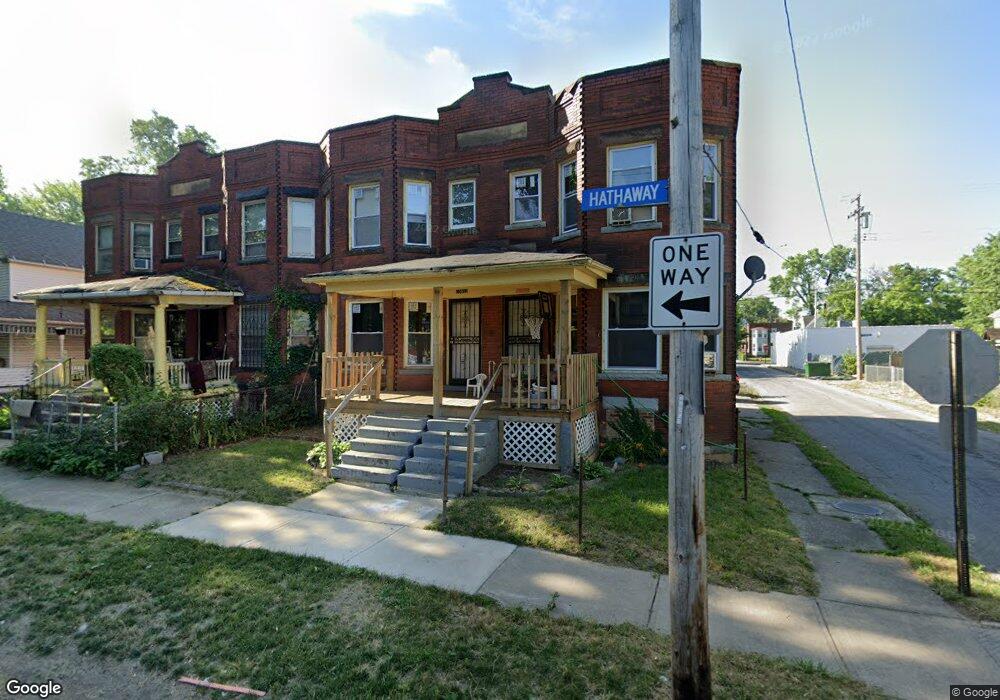
10802 Hathaway Ave Cleveland, OH 44108
Glenville NeighborhoodEstimated Value: $43,000 - $92,000
3
Beds
1
Bath
1,143
Sq Ft
$57/Sq Ft
Est. Value
About This Home
This home is located at 10802 Hathaway Ave, Cleveland, OH 44108 and is currently estimated at $65,140, approximately $56 per square foot. 10802 Hathaway Ave is a home located in Cuyahoga County with nearby schools including Bolton, Anton Grdina School, and Andrew J. Rickoff School.
Ownership History
Date
Name
Owned For
Owner Type
Purchase Details
Closed on
Nov 18, 2019
Sold by
Abdulhaqq Ibrahim
Bought by
Belegit Llc
Current Estimated Value
Purchase Details
Closed on
Feb 11, 2019
Sold by
Abdulhaqq Juwairriyah
Bought by
Abdulhaqq Ibrahim
Purchase Details
Closed on
Aug 20, 2018
Sold by
Tucker Aricka and Curts J Tucker Sr Trust
Bought by
Jones Barbara
Purchase Details
Closed on
Aug 23, 2017
Sold by
Jones Barbara
Bought by
Hagg Juwairriyah Abdof
Purchase Details
Closed on
Feb 2, 1995
Sold by
Darby Morris
Bought by
Curtis Tucker Sr Trust
Purchase Details
Closed on
Oct 30, 1991
Sold by
Darby Morris
Bought by
Darby Morris
Purchase Details
Closed on
Jan 26, 1979
Sold by
Darby Morris
Bought by
Darby Morris
Purchase Details
Closed on
Mar 16, 1978
Bought by
Darby Morris
Purchase Details
Closed on
Apr 12, 1977
Sold by
Randall Ethel
Bought by
Cleve Bldg Corp
Purchase Details
Closed on
Jan 1, 1975
Bought by
Randall Ethel
Create a Home Valuation Report for This Property
The Home Valuation Report is an in-depth analysis detailing your home's value as well as a comparison with similar homes in the area
Home Values in the Area
Average Home Value in this Area
Purchase History
| Date | Buyer | Sale Price | Title Company |
|---|---|---|---|
| Belegit Llc | -- | None Available | |
| Abdulhaqq Ibrahim | $7,300 | None Available | |
| Jones Barbara | $5,900 | None Available | |
| Hagg Juwairriyah Abdof | $5,900 | None Available | |
| Curtis Tucker Sr Trust | $5,000 | -- | |
| Darby Morris | -- | -- | |
| Darby Morris | -- | -- | |
| Darby Morris | $3,900 | -- | |
| Cleve Bldg Corp | $2,400 | -- | |
| Randall Ethel | -- | -- |
Source: Public Records
Tax History Compared to Growth
Tax History
| Year | Tax Paid | Tax Assessment Tax Assessment Total Assessment is a certain percentage of the fair market value that is determined by local assessors to be the total taxable value of land and additions on the property. | Land | Improvement |
|---|---|---|---|---|
| 2024 | $201 | $3,010 | $1,750 | $1,260 |
| 2023 | $242 | $3,120 | $980 | $2,140 |
| 2022 | $241 | $3,120 | $980 | $2,140 |
| 2021 | $238 | $3,120 | $980 | $2,140 |
| 2020 | $226 | $2,560 | $810 | $1,750 |
| 2019 | $444 | $7,300 | $2,300 | $5,000 |
| 2018 | $187 | $2,560 | $810 | $1,750 |
| 2017 | $171 | $2,070 | $490 | $1,580 |
| 2016 | $169 | $2,070 | $490 | $1,580 |
| 2015 | $191 | $2,070 | $490 | $1,580 |
| 2014 | $191 | $2,320 | $530 | $1,790 |
Source: Public Records
Map
Nearby Homes
- 10802 Hampden Ave
- 10750 Churchill Ave
- 10630 Tacoma Ave
- 10825 Orville Ave
- 10835 Orville Ave
- 10817 Orville Ave
- 10842 Grantwood Ave
- 0 Orville Ave Unit 4487982
- 1366 E 111th St
- 10927 Grantwood Ave
- 10602 Orville Ave
- 1377 E 111th St
- 10718 Drexel Ave
- 1190 E 112th St
- 1397 E 111th St
- 10404 South Blvd
- 1261 E 102nd St
- 1404 E 112th St
- 10201 Superior Ave
- 1435 E 108th St
- 10804 Hathaway Ave
- 10806 Hathaway Ave
- 10800 Hathaway Ave
- 10808 Hathaway Ave
- 10724 Hathaway Ave
- 10820 Hathaway Ave
- 10805 Hathaway Ave
- 10809 Hathaway Ave
- 10720 Hathaway Ave
- 10813 Hathaway Ave
- 10725 Hathaway Ave
- 10817 Hathaway Ave
- 10716 Hathaway Ave
- 10826 Hathaway Ave
- 10714 Hathaway Ave
- 10737 Superior Ave
- 10721 Hathaway Ave
- 10830 Hathaway Ave
- 10827 Hathaway Ave
- 10735 Superior Ave