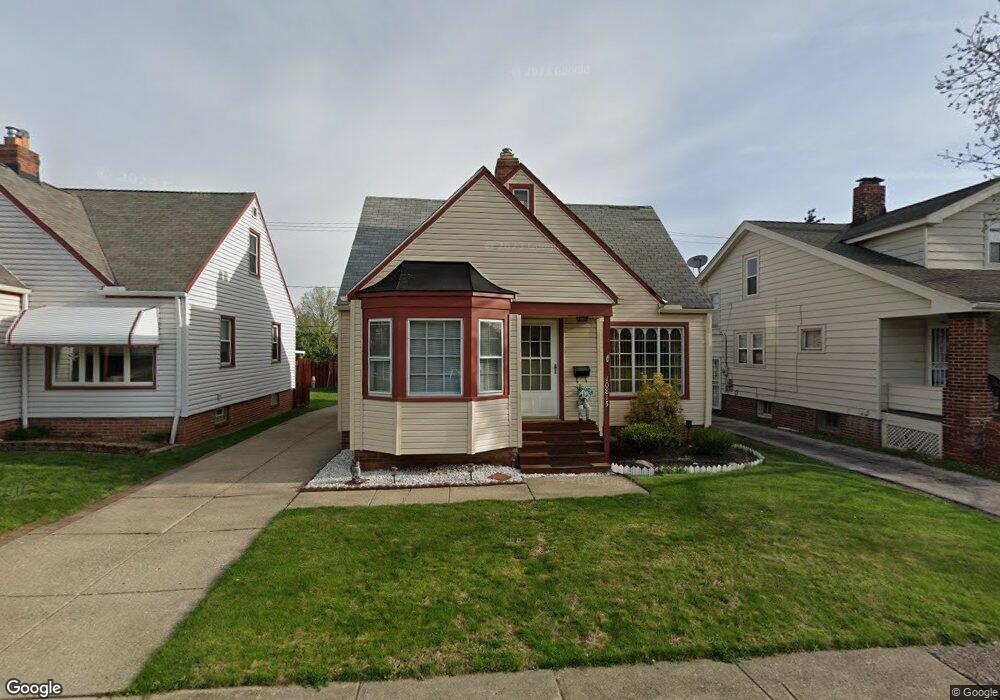
10815 Plymouth Ave Cleveland, OH 44125
Estimated Value: $115,000 - $168,000
3
Beds
1
Bath
1,257
Sq Ft
$104/Sq Ft
Est. Value
About This Home
This home is located at 10815 Plymouth Ave, Cleveland, OH 44125 and is currently estimated at $130,466, approximately $103 per square foot. 10815 Plymouth Ave is a home located in Cuyahoga County with nearby schools including Garfield Heights High School, North Shore High School, and Trinity High School.
Ownership History
Date
Name
Owned For
Owner Type
Purchase Details
Closed on
Nov 21, 2001
Sold by
Penza Regina L
Bought by
Owens Wayne and Owens Alanne
Current Estimated Value
Home Financials for this Owner
Home Financials are based on the most recent Mortgage that was taken out on this home.
Original Mortgage
$93,532
Interest Rate
6.64%
Purchase Details
Closed on
Mar 28, 2001
Sold by
Penza John D
Bought by
Penza Regina L
Home Financials for this Owner
Home Financials are based on the most recent Mortgage that was taken out on this home.
Original Mortgage
$3,787
Interest Rate
7.03%
Purchase Details
Closed on
Jan 31, 1989
Sold by
Hudak Susan
Bought by
Penza John D
Purchase Details
Closed on
Nov 21, 1988
Sold by
Hudak Steve and Hudak Susan
Bought by
Hudak Susan
Purchase Details
Closed on
Oct 22, 1984
Sold by
Hudak Steve and Hudak Susan
Bought by
Hudak Steve and Hudak Susan
Purchase Details
Closed on
Jan 1, 1975
Bought by
Hudak Steve and Hudak Susan
Create a Home Valuation Report for This Property
The Home Valuation Report is an in-depth analysis detailing your home's value as well as a comparison with similar homes in the area
Home Values in the Area
Average Home Value in this Area
Purchase History
| Date | Buyer | Sale Price | Title Company |
|---|---|---|---|
| Owens Wayne | $95,000 | Executive Title Agency Corp | |
| Penza Regina L | -- | -- | |
| Penza John D | $52,500 | -- | |
| Hudak Susan | -- | -- | |
| Hudak Steve | -- | -- | |
| Hudak Steve | -- | -- |
Source: Public Records
Mortgage History
| Date | Status | Borrower | Loan Amount |
|---|---|---|---|
| Previous Owner | Owens Wayne | $93,532 | |
| Previous Owner | Penza Regina L | $3,787 |
Source: Public Records
Tax History Compared to Growth
Tax History
| Year | Tax Paid | Tax Assessment Tax Assessment Total Assessment is a certain percentage of the fair market value that is determined by local assessors to be the total taxable value of land and additions on the property. | Land | Improvement |
|---|---|---|---|---|
| 2024 | $3,898 | $38,045 | $7,000 | $31,045 |
| 2023 | $2,753 | $24,500 | $4,760 | $19,740 |
| 2022 | $2,713 | $24,500 | $4,760 | $19,740 |
| 2021 | $2,865 | $24,500 | $4,760 | $19,740 |
| 2020 | $2,467 | $19,600 | $3,820 | $15,790 |
| 2019 | $2,445 | $56,000 | $10,900 | $45,100 |
| 2018 | $2,542 | $19,600 | $3,820 | $15,790 |
| 2017 | $2,435 | $18,310 | $3,050 | $15,260 |
| 2016 | $2,470 | $18,310 | $3,050 | $15,260 |
| 2015 | $2,716 | $18,310 | $3,050 | $15,260 |
| 2014 | $2,716 | $22,330 | $3,710 | $18,620 |
Source: Public Records
Map
Nearby Homes
- 10718 Vernon Ave
- 10717 Park Heights Ave
- 11105 Vernon Ave
- 4948 E 107th St
- 4953 E 106th St
- 4935 E 109th St
- 10501 Park Heights Ave
- 10916 Mccracken Rd
- 10609 Mccracken Blvd
- 10506 Park Heights Ave
- 11006 Mccracken Rd
- 11206 Park Heights Ave
- 11016 Mccracken Rd
- 10925 Thornton Ave
- 11209 Langton Ave
- 4885 E 107th St
- 11215 Langton Ave
- 10408 S Highland Ave
- 10016 Park Heights Ave
- 10417 Grace Ave
- 10819 Plymouth Ave
- 10811 Plymouth Ave
- 10807 Plymouth Ave
- 10823 Plymouth Ave
- 10812 Vernon Ave
- 10808 Vernon Ave
- 10816 Vernon Ave
- 10903 Plymouth Ave
- 10802 Vernon Ave
- 10822 Vernon Ave
- 10822 Plymouth Ave
- 10816 Plymouth Ave
- 10818 Plymouth Ave
- 10810 Plymouth Ave
- 10725 Plymouth Ave
- 10900 Vernon Ave
- 10806 Plymouth Ave
- 10902 Plymouth Ave
- 10720 Vernon Ave
- 10721 Plymouth Ave