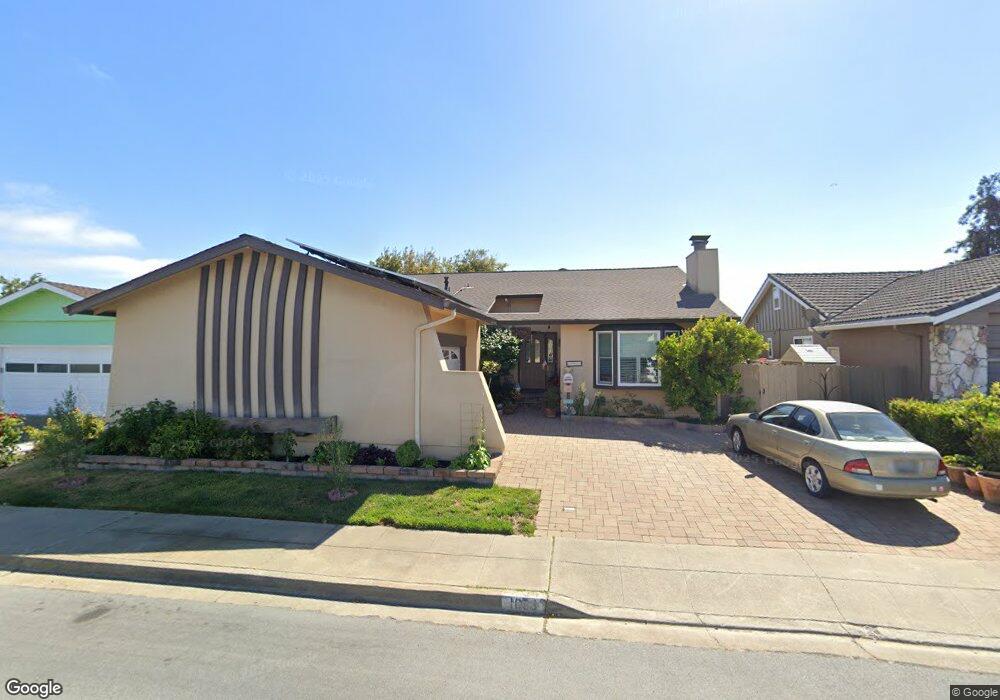
1083 Flying Fish St Foster City, CA 94404
Bay Vista NeighborhoodEstimated Value: $1,899,708 - $2,332,000
4
Beds
2
Baths
1,890
Sq Ft
$1,093/Sq Ft
Est. Value
About This Home
This home is located at 1083 Flying Fish St, Foster City, CA 94404 and is currently estimated at $2,065,927, approximately $1,093 per square foot. 1083 Flying Fish St is a home located in San Mateo County with nearby schools including Audubon Elementary School, Bowditch Middle School, and San Mateo High School.
Ownership History
Date
Name
Owned For
Owner Type
Purchase Details
Closed on
Sep 11, 2020
Sold by
Benton Family Trust and Benton Edward D
Bought by
Benton Edward D and Benton Judith A
Current Estimated Value
Home Financials for this Owner
Home Financials are based on the most recent Mortgage that was taken out on this home.
Original Mortgage
$358,604
Outstanding Balance
$318,237
Interest Rate
2.9%
Mortgage Type
VA
Estimated Equity
$1,747,690
Create a Home Valuation Report for This Property
The Home Valuation Report is an in-depth analysis detailing your home's value as well as a comparison with similar homes in the area
Home Values in the Area
Average Home Value in this Area
Purchase History
| Date | Buyer | Sale Price | Title Company |
|---|---|---|---|
| Benton Edward D | -- | Timios |
Source: Public Records
Mortgage History
| Date | Status | Borrower | Loan Amount |
|---|---|---|---|
| Open | Benton Edward D | $358,604 |
Source: Public Records
Tax History Compared to Growth
Tax History
| Year | Tax Paid | Tax Assessment Tax Assessment Total Assessment is a certain percentage of the fair market value that is determined by local assessors to be the total taxable value of land and additions on the property. | Land | Improvement |
|---|---|---|---|---|
| 2025 | $1,993 | $138,476 | $29,398 | $109,078 |
| 2023 | $1,993 | $133,101 | $28,257 | $104,844 |
| 2022 | $1,907 | $130,492 | $27,703 | $102,789 |
| 2021 | $1,870 | $127,934 | $27,160 | $100,774 |
| 2020 | $1,821 | $126,623 | $26,882 | $99,741 |
| 2019 | $1,736 | $124,141 | $26,355 | $97,786 |
| 2018 | $1,409 | $121,708 | $25,839 | $95,869 |
| 2017 | $1,390 | $119,323 | $25,333 | $93,990 |
| 2016 | $1,558 | $116,985 | $24,837 | $92,148 |
| 2015 | $1,518 | $115,228 | $24,464 | $90,764 |
| 2014 | $1,478 | $112,972 | $23,985 | $88,987 |
Source: Public Records
Map
Nearby Homes
- 1336 Marlin Ave
- 1351 Marlin Ave
- 1074 Eagle Ln
- 1463 Marlin Ave
- 224 Loon Ct
- 888 Sea Island Ln
- 241 Bonita Ln
- 275 Puffin Ct
- 370 Bramble Ct
- 3206 Admiralty Ln
- 1102 Admiralty Ln
- 1925 Beach Park Blvd
- 1131 Compass Ln Unit 108
- 591 Pilgrim Dr
- 1061 Beach Park Blvd Unit 216
- 1028 Foster Square Ln Unit 305
- 769 Eppleton Ln Unit 302
- 708 Thayer Ln Unit 404
- 1171 Compass Ln Unit 211
- 708 Eppleton Ln Unit 204
- 1089 Flying Fish St
- 1077 Flying Fish St
- 1311 Marlin Ave
- 1315 Marlin Ave
- 1307 Marlin Ave
- 1099 Flying Fish St
- 1069 Flying Fish St
- 1319 Marlin Ave
- 1301 Marlin Ave
- 1080 Flying Fish St
- 1088 Flying Fish St
- 1072 Flying Fish St
- 1059 Flying Fish St
- 1323 Marlin Ave
- 1098 Flying Fish St
- 1064 Flying Fish St
- 1051 Flying Fish St
- 1101 Flying Fish St
- 1327 Marlin Ave
- 1312 Marlin Ave