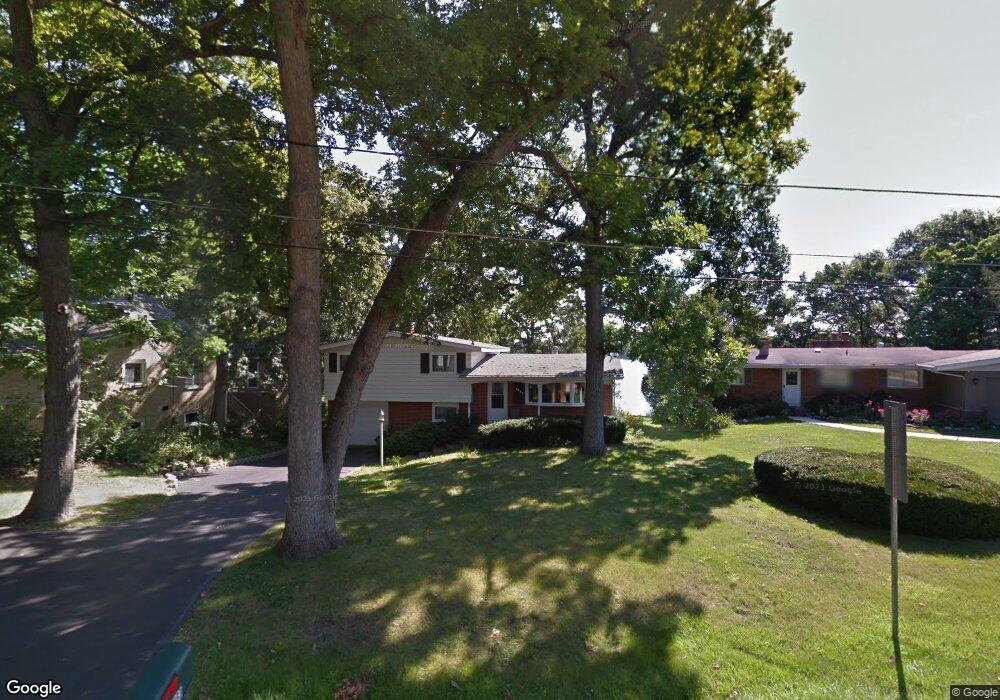
1083 Lomond Dr Mundelein, IL 60060
Loch Lomond NeighborhoodEstimated Value: $361,000 - $468,640
3
Beds
2
Baths
1,202
Sq Ft
$345/Sq Ft
Est. Value
About This Home
This home is located at 1083 Lomond Dr, Mundelein, IL 60060 and is currently estimated at $414,660, approximately $344 per square foot. 1083 Lomond Dr is a home located in Lake County with nearby schools including Mechanics Grove Elementary School, Washington Early Learning Center, and Carl Sandburg Middle School.
Ownership History
Date
Name
Owned For
Owner Type
Purchase Details
Closed on
Jun 26, 2020
Sold by
Udelle James C and Udelle Edward
Bought by
Gold Donald and Gold Alissa
Current Estimated Value
Purchase Details
Closed on
Sep 21, 2011
Sold by
Udelle Conrad S
Bought by
Udelle Conrad S
Home Financials for this Owner
Home Financials are based on the most recent Mortgage that was taken out on this home.
Original Mortgage
$173,000
Interest Rate
4.22%
Mortgage Type
New Conventional
Purchase Details
Closed on
Apr 25, 1997
Sold by
Donnelly Paul R and Donnelly Lesley C
Bought by
Udelle Conrad S
Home Financials for this Owner
Home Financials are based on the most recent Mortgage that was taken out on this home.
Original Mortgage
$210,000
Interest Rate
7.75%
Purchase Details
Closed on
Jul 19, 1995
Sold by
Gwin Jon O and Gwin Nancy R
Bought by
Donnelly Paul R and Donnelly Lesley C
Home Financials for this Owner
Home Financials are based on the most recent Mortgage that was taken out on this home.
Original Mortgage
$162,400
Interest Rate
5%
Create a Home Valuation Report for This Property
The Home Valuation Report is an in-depth analysis detailing your home's value as well as a comparison with similar homes in the area
Home Values in the Area
Average Home Value in this Area
Purchase History
| Date | Buyer | Sale Price | Title Company |
|---|---|---|---|
| Gold Donald | $270,000 | None Available | |
| Udelle Conrad S | -- | None Available | |
| Udelle Conrad S | $239,000 | Attorneys Natl Title Network | |
| Donnelly Paul R | $203,000 | Republic Title Company |
Source: Public Records
Mortgage History
| Date | Status | Borrower | Loan Amount |
|---|---|---|---|
| Previous Owner | Udelle Conrad S | $173,000 | |
| Previous Owner | Udelle Conrad S | $210,000 | |
| Previous Owner | Donnelly Paul R | $162,400 |
Source: Public Records
Tax History Compared to Growth
Tax History
| Year | Tax Paid | Tax Assessment Tax Assessment Total Assessment is a certain percentage of the fair market value that is determined by local assessors to be the total taxable value of land and additions on the property. | Land | Improvement |
|---|---|---|---|---|
| 2024 | $11,561 | $136,473 | $61,447 | $75,026 |
| 2023 | $11,263 | $116,864 | $52,618 | $64,246 |
| 2022 | $11,263 | $110,699 | $57,534 | $53,165 |
| 2021 | $10,777 | $106,822 | $55,519 | $51,303 |
| 2020 | $10,063 | $103,882 | $53,991 | $49,891 |
| 2019 | $9,731 | $100,466 | $52,216 | $48,250 |
| 2018 | $9,338 | $95,773 | $46,354 | $49,419 |
| 2017 | $6,370 | $92,758 | $44,895 | $47,863 |
| 2016 | $6,561 | $88,097 | $42,639 | $45,458 |
| 2015 | $6,860 | $82,589 | $39,973 | $42,616 |
| 2014 | $6,673 | $81,263 | $38,036 | $43,227 |
| 2012 | $8,668 | $81,985 | $38,374 | $43,611 |
Source: Public Records
Map
Nearby Homes
- 821 Killarney Pass Cir
- 1152 Aberdeen Ln
- 973 Highland Rd
- 728 W Maple Ave
- 212 Londonderry Ct
- 1304 Dunleer Dr
- 1021 Wrens Gate
- 851 Glenview Ave
- 1010 Evergreen St Unit 3
- 547 N Ridgemoor Ave
- 1291 Banbury Rd
- 200 Ambria Dr
- 620 Salceda Dr
- 1329 Turnberry Ln
- 742 N Lake St
- 591 Salceda Ln
- 531 Salceda Ln
- 137 Racine Place
- 1300 Kettering Rd
- 26220 N Midlothian Rd
- 1067 Lomond Dr
- 1107 Lomond Dr
- 1125 Lomond Dr
- 1043 Lomond Dr
- 1149 Lomond Dr
- 1027 Lomond Dr
- 1028 Lomond Dr
- 1167 Lomond Dr
- 1084 Lomond Dr
- 1108 Lomond Dr
- 1126 Lomond Dr
- 1189 Lomond Dr
- 1150 Lomond Dr
- 1005 Lomond Dr
- 1162 Lomond Dr
- 1006 Lomond Dr
- 755 Killarney Pass Cir
- 1107 Aberdeen Ln
- 1083 Aberdeen Ln
- 821 Killarney Pass Dr