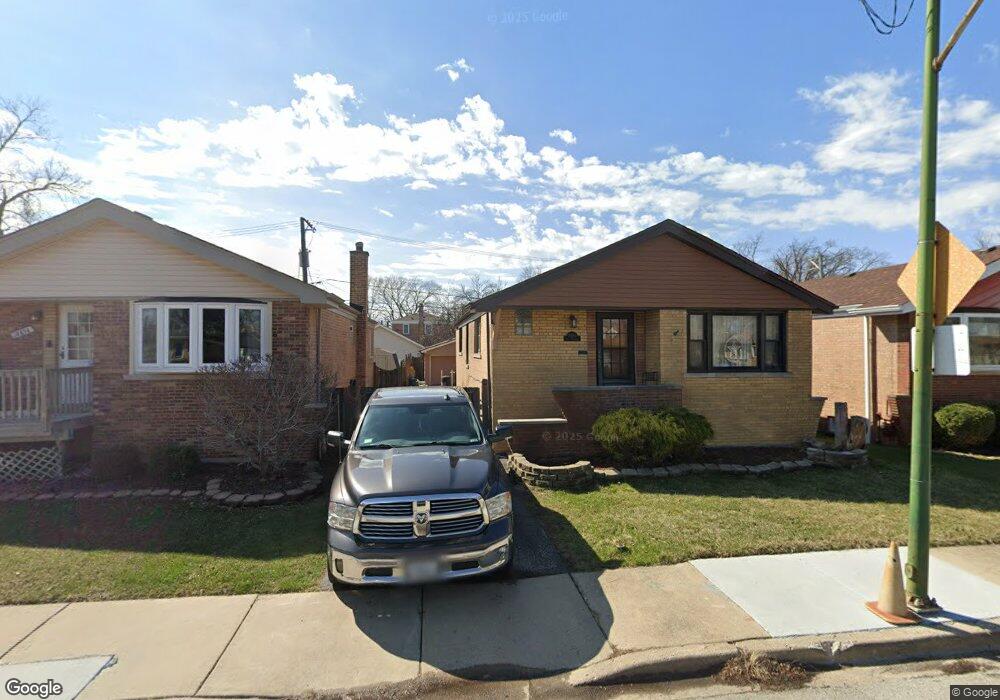
10830 S Rockwell St Chicago, IL 60655
Morgan Park NeighborhoodEstimated Value: $275,000 - $305,683
3
Beds
1
Bath
1,020
Sq Ft
$288/Sq Ft
Est. Value
About This Home
This home is located at 10830 S Rockwell St, Chicago, IL 60655 and is currently estimated at $293,421, approximately $287 per square foot. 10830 S Rockwell St is a home located in Cook County with nearby schools including Clissold Elementary School, Morgan Park High School, and St Cajetan Elementary School.
Ownership History
Date
Name
Owned For
Owner Type
Purchase Details
Closed on
Dec 27, 2005
Sold by
Stepanek Robert A and Stepanek Alicia M
Bought by
Perez Roland A
Current Estimated Value
Home Financials for this Owner
Home Financials are based on the most recent Mortgage that was taken out on this home.
Original Mortgage
$188,000
Outstanding Balance
$106,855
Interest Rate
6.46%
Mortgage Type
Fannie Mae Freddie Mac
Estimated Equity
$186,566
Purchase Details
Closed on
Apr 30, 1998
Sold by
Machowski Florence D and Machowski Frank S
Bought by
Stepanek Robert A and Stepanek Alicia M
Home Financials for this Owner
Home Financials are based on the most recent Mortgage that was taken out on this home.
Original Mortgage
$107,100
Interest Rate
7.19%
Purchase Details
Closed on
Jan 12, 1994
Sold by
Mount Greenwood Bank
Bought by
Machowski Frank S and Machowski Florence D
Create a Home Valuation Report for This Property
The Home Valuation Report is an in-depth analysis detailing your home's value as well as a comparison with similar homes in the area
Home Values in the Area
Average Home Value in this Area
Purchase History
| Date | Buyer | Sale Price | Title Company |
|---|---|---|---|
| Perez Roland A | $240,000 | Pntn | |
| Stepanek Robert A | $119,000 | -- | |
| Machowski Frank S | -- | -- |
Source: Public Records
Mortgage History
| Date | Status | Borrower | Loan Amount |
|---|---|---|---|
| Open | Perez Roland A | $188,000 | |
| Previous Owner | Stepanek Robert A | $107,100 |
Source: Public Records
Tax History Compared to Growth
Tax History
| Year | Tax Paid | Tax Assessment Tax Assessment Total Assessment is a certain percentage of the fair market value that is determined by local assessors to be the total taxable value of land and additions on the property. | Land | Improvement |
|---|---|---|---|---|
| 2024 | $3,529 | $24,001 | $4,688 | $19,313 |
| 2023 | $3,420 | $20,000 | $3,750 | $16,250 |
| 2022 | $3,420 | $20,000 | $3,750 | $16,250 |
| 2021 | $3,362 | $20,000 | $3,750 | $16,250 |
| 2020 | $3,916 | $20,638 | $3,562 | $17,076 |
| 2019 | $3,878 | $22,680 | $3,562 | $19,118 |
| 2018 | $3,811 | $22,680 | $3,562 | $19,118 |
| 2017 | $3,235 | $18,368 | $3,187 | $15,181 |
| 2016 | $3,186 | $18,368 | $3,187 | $15,181 |
| 2015 | $2,892 | $18,368 | $3,187 | $15,181 |
| 2014 | $2,590 | $16,493 | $3,000 | $13,493 |
| 2013 | $2,527 | $16,493 | $3,000 | $13,493 |
Source: Public Records
Map
Nearby Homes
- 10829 S Maplewood Ave
- 10735 S Washtenaw Ave
- 2518 W 109th Place
- 10741 S California Ave
- 2519 W 110th St
- 11017 S Campbell Ave
- 11125 S Fairfield Ave
- 2550 W 112th St Unit 12L
- 2550 W 112th St Unit 15-O
- 2336 W 111th St Unit 2
- 11138 S Artesian Ave
- 2348 W 111th St Unit 3
- 11224 S Fairfield Ave
- 10726 S Sacramento Ave
- 11255 S Fairfield Ave
- 2302 W 112th St
- 2300 W 112th St
- 2215 W 111th St Unit 101
- 11130 S Whipple St
- 11214 S Sacramento Ave
- 10828 S Rockwell St
- 10834 S Rockwell St
- 10824 S Rockwell St
- 10838 S Rockwell St
- 10820 S Rockwell St
- 10842 S Rockwell St
- 10831 S Talman Ave
- 10835 S Talman Ave
- 10827 S Talman Ave
- 10837 S Talman Ave
- 10816 S Rockwell St
- 10846 S Rockwell St
- 10823 S Talman Ave
- 10841 S Talman Ave
- 10812 S Rockwell St
- 10812 S Rockwell St
- 10850 S Rockwell St
- 10819 S Talman Ave
- 10812 S Rockwell St
- 10845 S Talman Ave