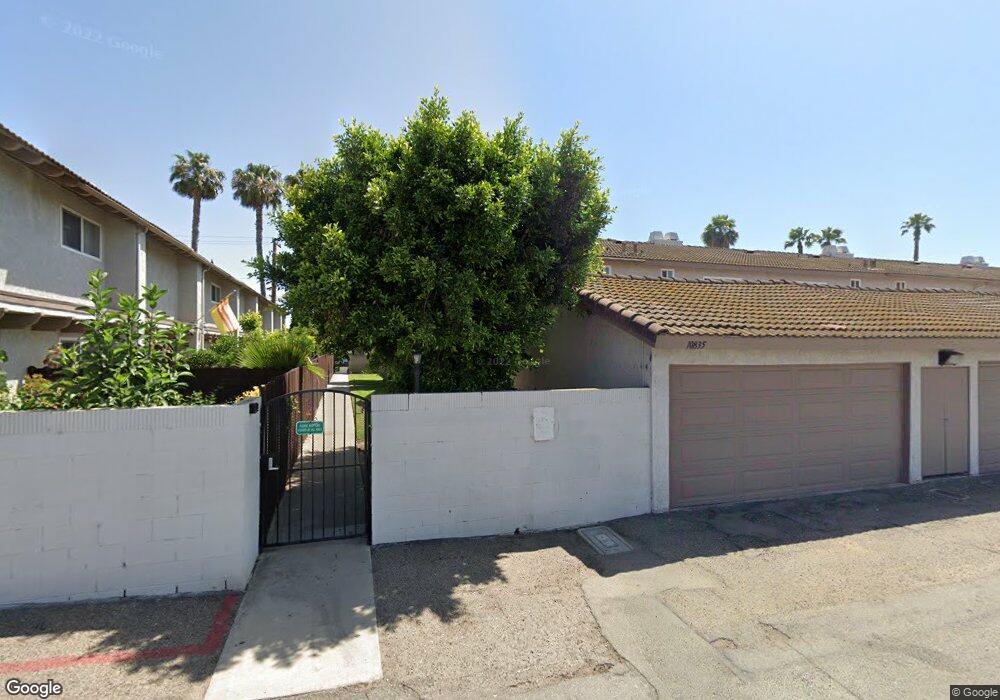
10835 Westminster Ave Garden Grove, CA 92843
Estimated Value: $650,028 - $728,000
2
Beds
2
Baths
1,349
Sq Ft
$504/Sq Ft
Est. Value
About This Home
This home is located at 10835 Westminster Ave, Garden Grove, CA 92843 and is currently estimated at $680,007, approximately $504 per square foot. 10835 Westminster Ave is a home located in Orange County with nearby schools including Excelsior Elementary School, Donald S. Jordan Intermediate School, and Bolsa Grande High School.
Ownership History
Date
Name
Owned For
Owner Type
Purchase Details
Closed on
Nov 2, 2013
Sold by
Vu Tan Quoc and Ha Nancy
Bought by
Tan Vu & Nancy Ha Family Trust
Current Estimated Value
Purchase Details
Closed on
Mar 7, 2003
Sold by
Ha Nancy
Bought by
Vu Tan Quoc and Ha Nancy
Purchase Details
Closed on
Nov 30, 1999
Sold by
Quoc Tan Vu
Bought by
Ha Nancy
Home Financials for this Owner
Home Financials are based on the most recent Mortgage that was taken out on this home.
Original Mortgage
$99,200
Outstanding Balance
$30,771
Interest Rate
7.96%
Estimated Equity
$649,236
Purchase Details
Closed on
Nov 10, 1999
Sold by
Williamson Cyd L
Bought by
Ha Nancy
Home Financials for this Owner
Home Financials are based on the most recent Mortgage that was taken out on this home.
Original Mortgage
$99,200
Outstanding Balance
$30,771
Interest Rate
7.96%
Estimated Equity
$649,236
Create a Home Valuation Report for This Property
The Home Valuation Report is an in-depth analysis detailing your home's value as well as a comparison with similar homes in the area
Home Values in the Area
Average Home Value in this Area
Purchase History
| Date | Buyer | Sale Price | Title Company |
|---|---|---|---|
| Tan Vu & Nancy Ha Family Trust | -- | None Available | |
| Vu Tan Quoc | -- | -- | |
| Ha Nancy | -- | American Title Co | |
| Ha Nancy | $124,000 | American Title Co |
Source: Public Records
Mortgage History
| Date | Status | Borrower | Loan Amount |
|---|---|---|---|
| Open | Ha Nancy | $99,200 |
Source: Public Records
Tax History Compared to Growth
Tax History
| Year | Tax Paid | Tax Assessment Tax Assessment Total Assessment is a certain percentage of the fair market value that is determined by local assessors to be the total taxable value of land and additions on the property. | Land | Improvement |
|---|---|---|---|---|
| 2025 | $2,539 | $190,571 | $64,277 | $126,294 |
| 2024 | $2,539 | $186,835 | $63,017 | $123,818 |
| 2023 | $2,487 | $183,172 | $61,781 | $121,391 |
| 2022 | $2,431 | $179,581 | $60,570 | $119,011 |
| 2021 | $2,404 | $176,060 | $59,382 | $116,678 |
| 2020 | $2,372 | $174,255 | $58,773 | $115,482 |
| 2019 | $2,329 | $170,839 | $57,621 | $113,218 |
| 2018 | $2,284 | $167,490 | $56,491 | $110,999 |
| 2017 | $2,251 | $164,206 | $55,383 | $108,823 |
| 2016 | $2,147 | $160,987 | $54,297 | $106,690 |
| 2015 | $2,116 | $158,569 | $53,481 | $105,088 |
| 2014 | $2,064 | $155,463 | $52,433 | $103,030 |
Source: Public Records
Map
Nearby Homes
- 14151 Lake St
- 13611 Glenhaven Dr
- 14356 Taft St
- 13322 Euclid St
- 11321 Parkgreen Ln Unit 102
- 14376 Euclid St Unit 1-4
- 1609 N Parsons Place
- 10886 Lotus Dr
- 13372 Jessica Dr
- 13312 Michael Rainford Cir
- 5317 Silver Dr
- 14171 Flower St Unit 13
- 14171 Flower St
- 10061 15th St
- 5405 W 4th St
- 1114 N Gates St
- 10391 Mildred Ave
- 10422 Bonnie Dr
- 4832 W 5th St Unit B
- 10836 Sonoma Ln
- 10831 Westminster Ave
- 10827 Westminster Ave
- 10825 Westminster Ave
- 10841 Westminster Ave
- 10823 Westminster Ave
- 10839 Westminster Ave
- 10847 Westminster Ave
- 10859 Westminster Ave
- 10851 Westminster Ave
- 10819 Westminster Ave
- 10857 Westminster Ave
- 10815 Westminster Ave
- 10807 Westminster Ave
- 10805 Westminster Ave
- 10811 Westminster Ave
- 10803 Westminster Ave
- 10799 Westminster Ave
- 10795 Westminster Ave
- 13951 Fernwood Dr
- 10791 Westminster Ave