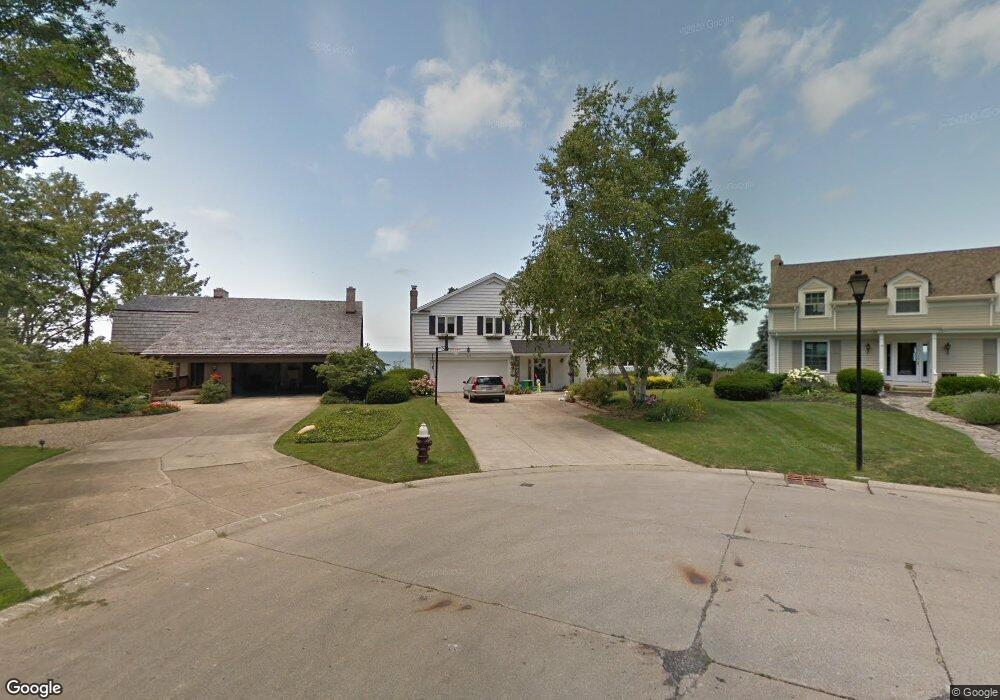
1084 Lake Point Dr Lakewood, OH 44107
Estimated Value: $767,000 - $1,202,557
3
Beds
3
Baths
2,491
Sq Ft
$410/Sq Ft
Est. Value
About This Home
This home is located at 1084 Lake Point Dr, Lakewood, OH 44107 and is currently estimated at $1,020,139, approximately $409 per square foot. 1084 Lake Point Dr is a home with nearby schools including Horace Mann Elementary School, Harding Middle School, and Lakewood High School.
Ownership History
Date
Name
Owned For
Owner Type
Purchase Details
Closed on
Nov 24, 2009
Sold by
Tazelaar George J and Tazelaar Ingrid
Bought by
Bjorn Paul Anders and Bjorn Jean Mazgaj
Current Estimated Value
Home Financials for this Owner
Home Financials are based on the most recent Mortgage that was taken out on this home.
Original Mortgage
$85,000
Interest Rate
4.52%
Mortgage Type
Stand Alone Second
Purchase Details
Closed on
Oct 7, 2005
Sold by
Tazelaar George J and Tazelaar Ingrid
Bought by
Tazelaar Ingrid and Tazelaar George J
Purchase Details
Closed on
Aug 14, 1998
Sold by
Tazelaar George J
Bought by
Tazelaar George J and Tazelaar Ingris
Purchase Details
Closed on
Feb 24, 1989
Sold by
Tazelaar George and Tazelaar Dorothy
Bought by
Tazelaar George J
Purchase Details
Closed on
Jan 1, 1975
Bought by
Tazelaar George and Tazelaar Dorothy
Create a Home Valuation Report for This Property
The Home Valuation Report is an in-depth analysis detailing your home's value as well as a comparison with similar homes in the area
Home Values in the Area
Average Home Value in this Area
Purchase History
| Date | Buyer | Sale Price | Title Company |
|---|---|---|---|
| Bjorn Paul Anders | $670,000 | Attorney | |
| Tazelaar Ingrid | -- | -- | |
| Tazelaar George J | -- | -- | |
| Tazelaar George J | -- | -- | |
| Tazelaar George | -- | -- |
Source: Public Records
Mortgage History
| Date | Status | Borrower | Loan Amount |
|---|---|---|---|
| Closed | Bjorn Paul Anders | $85,000 | |
| Closed | Bjorn Paul Anders | $417,000 |
Source: Public Records
Tax History Compared to Growth
Tax History
| Year | Tax Paid | Tax Assessment Tax Assessment Total Assessment is a certain percentage of the fair market value that is determined by local assessors to be the total taxable value of land and additions on the property. | Land | Improvement |
|---|---|---|---|---|
| 2024 | $20,238 | $315,105 | $81,235 | $233,870 |
| 2023 | $19,045 | $253,750 | $108,570 | $145,180 |
| 2022 | $19,167 | $253,750 | $108,570 | $145,180 |
| 2021 | $20,194 | $270,100 | $108,570 | $161,530 |
| 2020 | $18,631 | $217,840 | $87,570 | $130,270 |
| 2019 | $18,263 | $622,400 | $250,200 | $372,200 |
| 2018 | $19,312 | $217,840 | $87,570 | $130,270 |
| 2017 | $19,351 | $210,000 | $55,230 | $154,770 |
| 2016 | $19,218 | $210,000 | $55,230 | $154,770 |
| 2015 | $18,833 | $222,810 | $55,230 | $167,580 |
| 2014 | $18,833 | $197,760 | $47,220 | $150,540 |
Source: Public Records
Map
Nearby Homes
- 17852 Lake Rd
- 19486 Frazier Dr
- 387 S Island Dr
- 19334 Frazier Dr
- 0 Riverdale Dr Unit 5078145
- 0 Riverdale Dr
- 416 Riverdale Dr
- 19204 Frazier Dr
- 19000 Lake Rd Unit 915
- 19000 Lake Rd Unit 730
- 1279 Arlington Rd
- 19665 Roslyn Dr
- 1350 Edanola Ave
- 17820 Lake Ave
- 1363 W Clifton Blvd
- 23 Mckinley Place
- 1330 Webb Rd
- 19740 Lake Rd Unit 19740
- 1354 Webb Rd
- 1431 Maile Ave