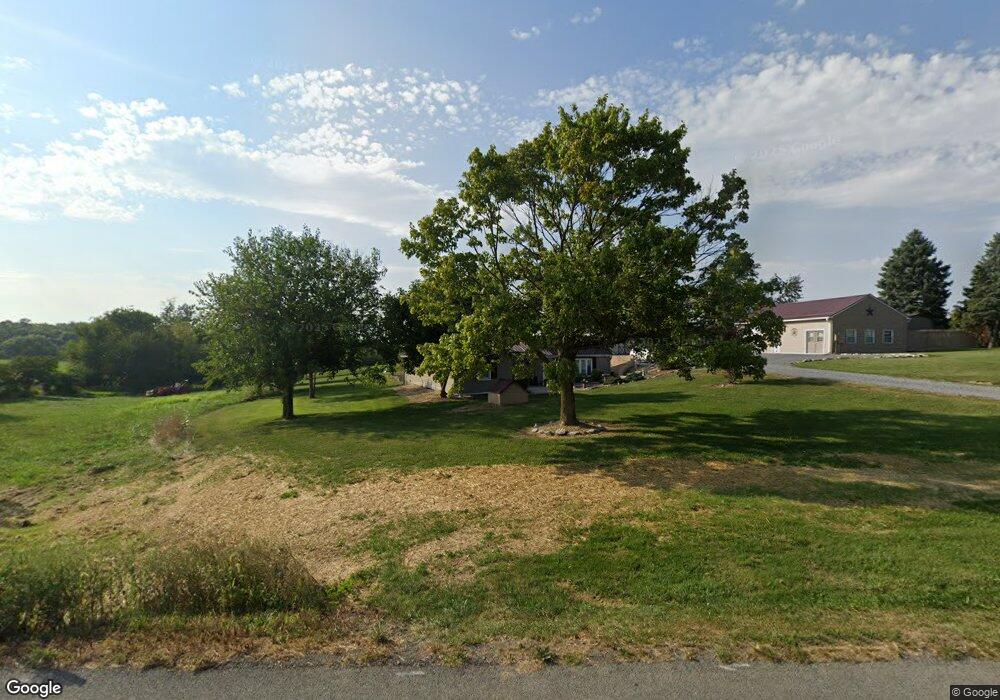
10844 Grant Shook Rd Greencastle, PA 17225
Estimated Value: $225,000 - $281,333
--
Bed
--
Bath
904
Sq Ft
$273/Sq Ft
Est. Value
About This Home
This home is located at 10844 Grant Shook Rd, Greencastle, PA 17225 and is currently estimated at $246,833, approximately $273 per square foot. 10844 Grant Shook Rd is a home located in Franklin County with nearby schools including Greencastle-Antrim Primary School, Greencastle-Antrim Elementary School, and Greencastle-Antrim Middle School.
Ownership History
Date
Name
Owned For
Owner Type
Purchase Details
Closed on
Jun 8, 2007
Sold by
Mclaughlin Calvin and Mclaughlin Serena
Bought by
Iden Robert L and Iden Sandra S
Current Estimated Value
Home Financials for this Owner
Home Financials are based on the most recent Mortgage that was taken out on this home.
Original Mortgage
$139,500
Outstanding Balance
$95,865
Interest Rate
8.6%
Mortgage Type
Assumption
Estimated Equity
$150,968
Purchase Details
Closed on
Feb 17, 2006
Sold by
Barnes David L and Barnes Lori Lynne
Bought by
Mclaughlin Calvin and Mclaughlin Serena
Home Financials for this Owner
Home Financials are based on the most recent Mortgage that was taken out on this home.
Original Mortgage
$168,667
Interest Rate
6.16%
Mortgage Type
FHA
Create a Home Valuation Report for This Property
The Home Valuation Report is an in-depth analysis detailing your home's value as well as a comparison with similar homes in the area
Home Values in the Area
Average Home Value in this Area
Purchase History
| Date | Buyer | Sale Price | Title Company |
|---|---|---|---|
| Iden Robert L | $155,000 | None Available | |
| Mclaughlin Calvin | $170,000 | None Available |
Source: Public Records
Mortgage History
| Date | Status | Borrower | Loan Amount |
|---|---|---|---|
| Open | Iden Robert L | $139,500 | |
| Previous Owner | Mclaughlin Calvin | $168,667 |
Source: Public Records
Tax History Compared to Growth
Tax History
| Year | Tax Paid | Tax Assessment Tax Assessment Total Assessment is a certain percentage of the fair market value that is determined by local assessors to be the total taxable value of land and additions on the property. | Land | Improvement |
|---|---|---|---|---|
| 2025 | $2,636 | $15,760 | $2,000 | $13,760 |
| 2024 | $2,392 | $15,760 | $2,000 | $13,760 |
| 2023 | $2,106 | $14,040 | $2,000 | $12,040 |
| 2022 | $2,106 | $14,040 | $2,000 | $12,040 |
| 2021 | $2,065 | $14,040 | $2,000 | $12,040 |
| 2020 | $2,011 | $14,040 | $2,000 | $12,040 |
| 2019 | $1,965 | $14,040 | $2,000 | $12,040 |
| 2018 | $1,944 | $14,040 | $2,000 | $12,040 |
| 2017 | $1,895 | $14,040 | $2,000 | $12,040 |
| 2016 | $402 | $14,040 | $2,000 | $12,040 |
| 2015 | $359 | $13,430 | $2,000 | $11,430 |
| 2014 | $359 | $13,430 | $2,000 | $11,430 |
Source: Public Records
Map
Nearby Homes
- 281 Toms Ln
- 1223 E Pebblebrook Dr
- 11765 Melrose Ave
- 707 Shook Ct W
- 20 Helens Dr
- 375 Carolle St
- 11498 Nicole Dr
- 382 Teaberry Dr
- 12976 Daybreak Ln
- 763 Joy Dr
- 3125 Buchanan Trail W
- 480 S Carlisle St
- 10937 Grant Shook Rd
- 10925 Grant Shook Rd
- 112541 Shannon Dr S
- 112566 Shannon Dr S
- 112501 Shannon Dr S
- 1014 Divinity Dr
- 112506 Shannon Dr S
- 112531 Shannon Dr S
- 10809 Grant Shook Rd
- 10721 Grant Shook Rd
- 1112 Lindale Ave E
- 0 Cydney Ln Unit FL8762402
- 0 Dallas Dr E Unit FL6369795
- 10919 Grant Shook Rd
- 10917 Grant Shook Rd
- 10698 Grant Shook Rd
- 10445 Grant Shook Rd
- 2372 Buchanan Trail W
- 11193 Grant Shook Rd
- 2370 Buchanan Trail W
- 2140 Buchanan Trail W
- 10649 Grant Shook Rd
- 2160 Buchanan Trail W
- 8966 8966
- LOT 102 Emilys
- 0 Emily's Ct Unit 1004229500
- 0 Cydney Ln Unit FL9765641
- 0 Cydney Ln Unit FL8761935