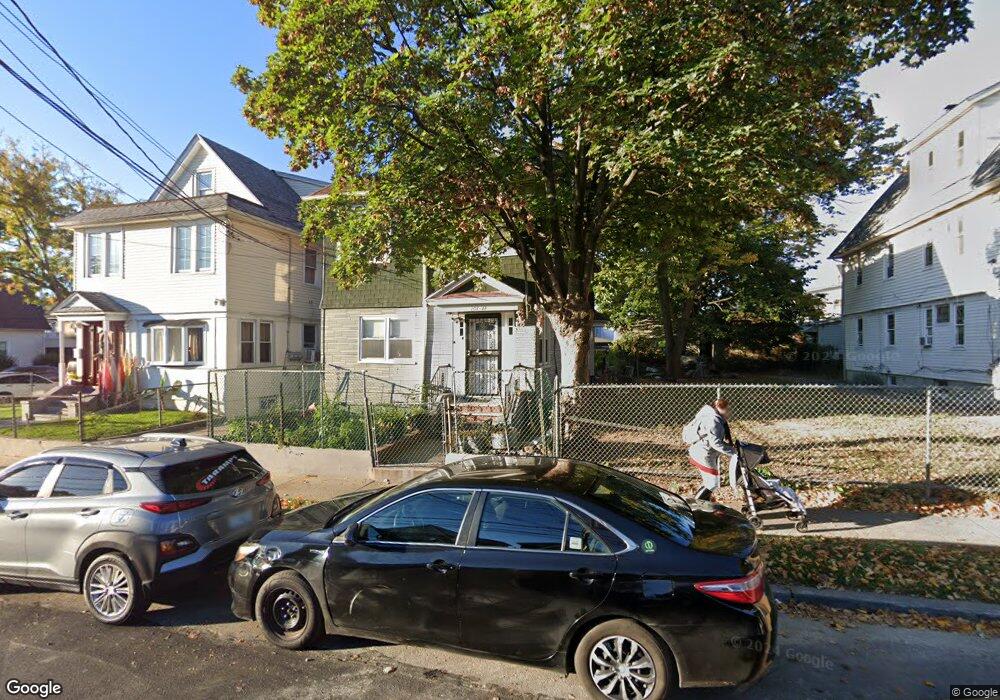
10848 Liverpool St Jamaica, NY 11435
Jamaica NeighborhoodEstimated Value: $981,000 - $1,036,000
--
Bed
--
Bath
2,400
Sq Ft
$421/Sq Ft
Est. Value
About This Home
This home is located at 10848 Liverpool St, Jamaica, NY 11435 and is currently estimated at $1,010,333, approximately $420 per square foot. 10848 Liverpool St is a home located in Queens County with nearby schools including P.S. 160 Walter Francis Bishop and Junior High School 8 Richard S Grossley.
Ownership History
Date
Name
Owned For
Owner Type
Purchase Details
Closed on
Aug 13, 2025
Sold by
Estate Of Cecil Lowe and Lowe Administratrix
Bought by
Lowe Beverly and Lowe David
Current Estimated Value
Home Financials for this Owner
Home Financials are based on the most recent Mortgage that was taken out on this home.
Original Mortgage
$25,000
Interest Rate
6.74%
Mortgage Type
Purchase Money Mortgage
Purchase Details
Closed on
Apr 29, 1999
Sold by
Lowe Cecil and Lowe Elvina
Bought by
Lowe Cecil and Lowe Elvina
Home Financials for this Owner
Home Financials are based on the most recent Mortgage that was taken out on this home.
Original Mortgage
$171,000
Interest Rate
6.9%
Mortgage Type
Purchase Money Mortgage
Purchase Details
Closed on
Jan 24, 1997
Sold by
Lowe Cecil and Lowe Elvina
Bought by
Lowe Cecil and Lowe Elvina
Home Financials for this Owner
Home Financials are based on the most recent Mortgage that was taken out on this home.
Original Mortgage
$105,800
Interest Rate
7.68%
Mortgage Type
Purchase Money Mortgage
Create a Home Valuation Report for This Property
The Home Valuation Report is an in-depth analysis detailing your home's value as well as a comparison with similar homes in the area
Home Values in the Area
Average Home Value in this Area
Purchase History
| Date | Buyer | Sale Price | Title Company |
|---|---|---|---|
| Lowe Beverly | -- | -- | |
| Lowe Cecil | -- | -- | |
| Lowe Cecil | -- | -- | |
| Lowe Cecil | -- | -- | |
| Lowe Cecil | -- | -- |
Source: Public Records
Mortgage History
| Date | Status | Borrower | Loan Amount |
|---|---|---|---|
| Closed | Lowe Beverly | $25,000 | |
| Closed | Lowe Cecil | $171,000 | |
| Closed | Lowe Cecil | $105,800 |
Source: Public Records
Tax History Compared to Growth
Tax History
| Year | Tax Paid | Tax Assessment Tax Assessment Total Assessment is a certain percentage of the fair market value that is determined by local assessors to be the total taxable value of land and additions on the property. | Land | Improvement |
|---|---|---|---|---|
| 2025 | $6,244 | $32,486 | $7,356 | $25,130 |
| 2024 | $6,256 | $32,486 | $8,818 | $23,668 |
| 2023 | $5,906 | $30,804 | $7,823 | $22,981 |
| 2022 | $5,606 | $41,160 | $12,540 | $28,620 |
| 2021 | $5,515 | $39,720 | $12,540 | $27,180 |
| 2020 | $5,434 | $38,400 | $12,540 | $25,860 |
| 2019 | $5,370 | $41,700 | $12,540 | $29,160 |
| 2018 | $4,935 | $25,670 | $10,687 | $14,983 |
| 2017 | $4,637 | $24,218 | $9,828 | $14,390 |
| 2016 | $4,470 | $24,218 | $9,828 | $14,390 |
| 2015 | $2,536 | $22,560 | $12,491 | $10,069 |
| 2014 | $2,536 | $22,560 | $13,052 | $9,508 |
Source: Public Records
Map
Nearby Homes
- 145-47 109th Ave
- 145-51 Arlington Terrace
- 145-03 Ferndale Ave
- 145-24 Lakewood Ave
- 107-43 Inwood St
- 10753 Spa Place
- 146-19 Lakewood Ave
- 147-47 Ferndale Ave
- 146-14 Shore Ave
- 14415 Lux Rd
- 145 Central Park N Unit 6C
- 145 Central Park N Unit 2-A
- 143-14 Lakewood Ave
- 109-29 143rd St
- 145-50 107th Ave
- 10701 Liverpool St
- 150-12 109th Ave
- 145-44 Tuskegee Airmen Way
- 10650 Waltham St
- 14538 Tuskegee Airmen Way
- 10848 Liverpool St
- 10852 Liverpool St
- 108-44 Liverpool St Unit 2
- 108-44 Liverpool St
- 10844 Liverpool St
- 10844 Liverpool St
- 14553 109th Ave
- 10842 Liverpool St
- 14551 109th Ave
- 14551 109th Ave
- 10840 Liverpool St
- 14554 Arlington Terrace
- 14547 109th Ave
- 14547 109th Ave
- 14547 109th Ave Unit 2
- 108-55 Liverpool St
- 10847 Liverpool St
- 10851 Liverpool St
- 14552 Arlington Terrace
- 10845 Liverpool St