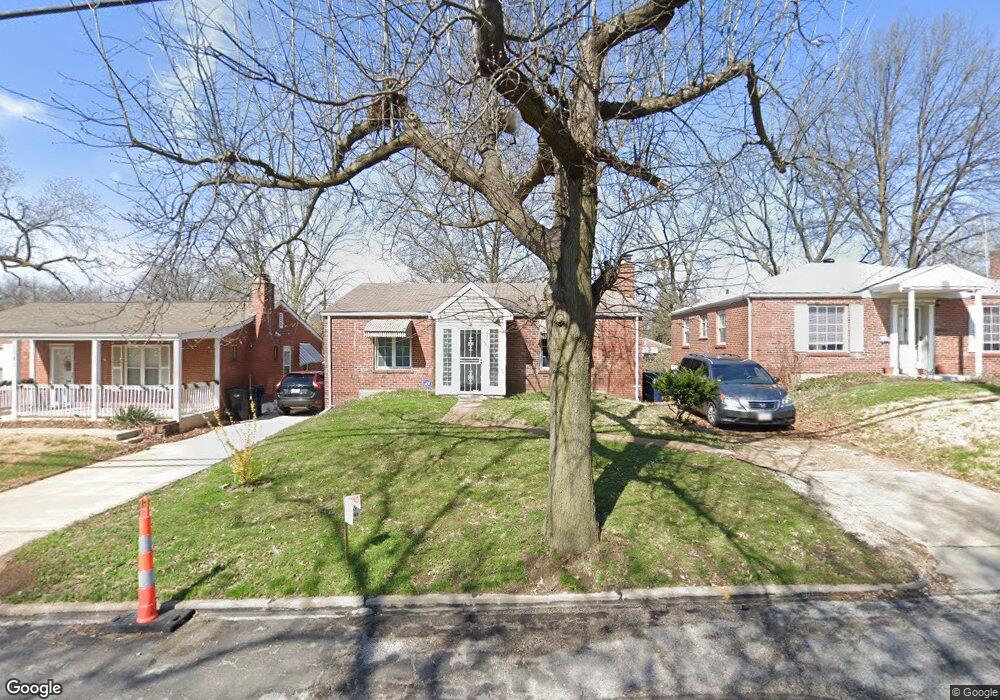
1085 N and South Rd Saint Louis, MO 63130
Estimated Value: $158,000 - $194,000
2
Beds
2
Baths
1,080
Sq Ft
$159/Sq Ft
Est. Value
About This Home
This home is located at 1085 N and South Rd, Saint Louis, MO 63130 and is currently estimated at $172,086, approximately $159 per square foot. 1085 N and South Rd is a home located in St. Louis County with nearby schools including Jackson Park Elementary School, Brittany Woods Middle School, and University City High School.
Ownership History
Date
Name
Owned For
Owner Type
Purchase Details
Closed on
May 31, 2022
Sold by
Eunhee Lee Ester
Bought by
Lee Samuel Sanghoon and Lee Bomee
Current Estimated Value
Purchase Details
Closed on
Sep 29, 2015
Sold by
Secretary Of Housing & Urban Development
Bought by
Lee Ester Eunhee
Purchase Details
Closed on
Dec 10, 2014
Sold by
U S Bank National Association
Bought by
Secretary Of Housing & Urban Development
Purchase Details
Closed on
Nov 14, 2014
Sold by
Scott Adriane A
Bought by
U S Bank National Association
Purchase Details
Closed on
Jun 1, 2000
Sold by
Hamilton Leslie L and Hamilton Mary L
Bought by
Scott Adriane A
Home Financials for this Owner
Home Financials are based on the most recent Mortgage that was taken out on this home.
Original Mortgage
$66,462
Interest Rate
8.13%
Mortgage Type
FHA
Create a Home Valuation Report for This Property
The Home Valuation Report is an in-depth analysis detailing your home's value as well as a comparison with similar homes in the area
Home Values in the Area
Average Home Value in this Area
Purchase History
| Date | Buyer | Sale Price | Title Company |
|---|---|---|---|
| Lee Samuel Sanghoon | -- | -- | |
| Lee Ester Eunhee | $33,000 | Investors Title Co Clayton | |
| Secretary Of Housing & Urban Development | -- | None Available | |
| U S Bank National Association | $30,400 | None Available | |
| Scott Adriane A | $66,500 | -- |
Source: Public Records
Mortgage History
| Date | Status | Borrower | Loan Amount |
|---|---|---|---|
| Previous Owner | Scott Adriane A | $66,462 |
Source: Public Records
Tax History Compared to Growth
Tax History
| Year | Tax Paid | Tax Assessment Tax Assessment Total Assessment is a certain percentage of the fair market value that is determined by local assessors to be the total taxable value of land and additions on the property. | Land | Improvement |
|---|---|---|---|---|
| 2025 | $2,236 | $33,980 | $8,610 | $25,370 |
| 2024 | $2,236 | $31,030 | $8,610 | $22,420 |
| 2023 | $2,233 | $31,030 | $8,610 | $22,420 |
| 2022 | $1,776 | $22,860 | $6,880 | $15,980 |
| 2021 | $1,758 | $22,860 | $6,880 | $15,980 |
| 2020 | $1,688 | $21,360 | $5,150 | $16,210 |
| 2019 | $1,672 | $21,360 | $5,150 | $16,210 |
| 2018 | $1,663 | $19,650 | $4,470 | $15,180 |
| 2017 | $1,667 | $19,650 | $4,470 | $15,180 |
| 2016 | $1,301 | $14,560 | $4,470 | $10,090 |
| 2015 | $1,307 | $14,560 | $4,470 | $10,090 |
| 2014 | $1,171 | $12,770 | $2,260 | $10,510 |
Source: Public Records
Map
Nearby Homes
- 1059 N and South Rd
- 7742 Elene Ave
- 7723 Wild Plum Ln
- 7478 Drexel Dr
- 7475 Drexel Dr
- 7576 Melrose Ave
- 946 Abbeville Dr
- 7634 Balson Ave
- 846 Wild Cherry Ln
- 7529 Melrose Ave
- 1276 N and Rd S
- 7525 Dajoby Ln
- 7584 Amherst Ave
- 1237 Fairview Ave
- 1077 N Jackson Ave
- 955 Mulberry Ln
- 7823 Stanford Ave
- 7343 Drexel Dr
- 1323 Fairview Ave
- 7843 Cornell Ave
- 1085 N and Rd S
- 1081 N and South Rd
- 1093 N and South Rd
- 1089 N and South Rd
- 1077 N and South Rd
- 1084 North and South Rd
- 1080 Wilshire Ave
- 1088 North and South Rd
- 1086 Wilshire Ave
- 1075 N and South Rd
- 1076 North and South Rd
- 1076 Wilshire Ave
- 1084 N and South Rd
- 1090 Wilshire Ave
- 1092 N and Rd S
- 1088 N and South Rd
- 1071 North and South Rd
- 1074 Wilshire Ave
- 1101 N and South Rd
- 1080 N and South Rd