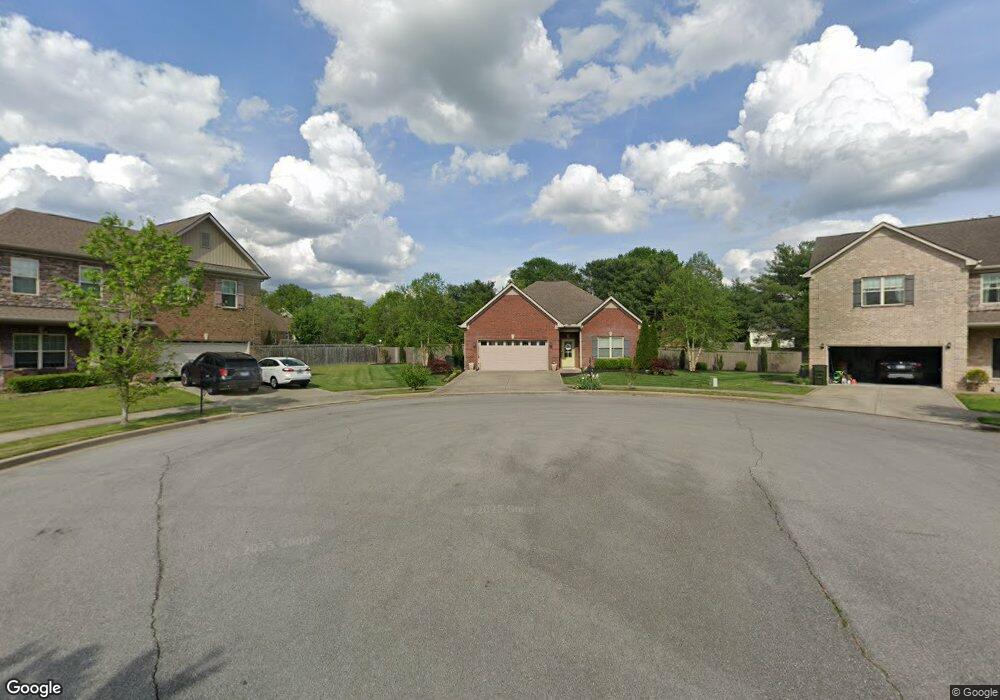
1088 E Sagewood Dr Gallatin, TN 37066
Estimated Value: $450,000 - $488,000
3
Beds
2
Baths
1,601
Sq Ft
$292/Sq Ft
Est. Value
About This Home
This home is located at 1088 E Sagewood Dr, Gallatin, TN 37066 and is currently estimated at $468,279, approximately $292 per square foot. 1088 E Sagewood Dr is a home located in Sumner County with nearby schools including Howard Elementary School, Rucker Stewart Middle School, and Station Camp High School.
Ownership History
Date
Name
Owned For
Owner Type
Purchase Details
Closed on
Nov 15, 2019
Sold by
Mcdaniel Morris D and Mcdaniel Pamela G
Bought by
Hatcher Richard A and Hatcher Carol A
Current Estimated Value
Purchase Details
Closed on
Apr 17, 2015
Sold by
Ole South Properties Inc
Bought by
Mcdaniel Morris D and Mcdaniel Pamela G
Home Financials for this Owner
Home Financials are based on the most recent Mortgage that was taken out on this home.
Original Mortgage
$209,142
Interest Rate
3.25%
Mortgage Type
FHA
Purchase Details
Closed on
Oct 21, 2014
Sold by
Park Stratford
Bought by
Ole South Properties Inc
Home Financials for this Owner
Home Financials are based on the most recent Mortgage that was taken out on this home.
Original Mortgage
$160,000
Interest Rate
4.26%
Mortgage Type
Unknown
Create a Home Valuation Report for This Property
The Home Valuation Report is an in-depth analysis detailing your home's value as well as a comparison with similar homes in the area
Home Values in the Area
Average Home Value in this Area
Purchase History
| Date | Buyer | Sale Price | Title Company |
|---|---|---|---|
| Hatcher Richard A | $274,900 | None Available | |
| Mcdaniel Morris D | $213,454 | Tri Star Title & Escrow Llc | |
| Ole South Properties Inc | $39,250 | Tri Star Title & Escrow Llc |
Source: Public Records
Mortgage History
| Date | Status | Borrower | Loan Amount |
|---|---|---|---|
| Previous Owner | Mcdaniel Morris D | $209,142 | |
| Previous Owner | Ole South Properties Inc | $160,000 |
Source: Public Records
Tax History Compared to Growth
Tax History
| Year | Tax Paid | Tax Assessment Tax Assessment Total Assessment is a certain percentage of the fair market value that is determined by local assessors to be the total taxable value of land and additions on the property. | Land | Improvement |
|---|---|---|---|---|
| 2024 | $1,529 | $107,600 | $18,750 | $88,850 |
| 2023 | $2,251 | $73,775 | $16,250 | $57,525 |
| 2022 | $2,259 | $73,775 | $16,250 | $57,525 |
| 2021 | $2,039 | $66,575 | $16,250 | $50,325 |
| 2020 | $2,039 | $66,575 | $16,250 | $50,325 |
| 2019 | $2,039 | $0 | $0 | $0 |
| 2018 | $1,624 | $0 | $0 | $0 |
| 2017 | $1,624 | $0 | $0 | $0 |
| 2016 | $1,163 | $0 | $0 | $0 |
| 2015 | -- | $0 | $0 | $0 |
Source: Public Records
Map
Nearby Homes
- 294 Buckingham Blvd
- 1239 Wentworth Dr
- 1245 Amherst Ct
- 130 Saxony Way
- 376 Huntington Dr
- 156 Hackney Ln
- 139 Buckingham Blvd
- 1273 Wentworth Dr
- 420 Dorchester Place
- 300 Remington Ave
- 415 Buckingham Blvd
- 305 Remington Ave
- 1182 Long Hollow Pike Unit G3
- 810 Walpole Dr
- 808 Walpole Dr
- 540 Bradford Dr
- 414 Stratford Park Blvd
- 1328 Wentworth Dr
- 806 Warrington Ct
- 608 Bradford Dr
- 1088 E Sagewood Dr
- 1084 E Sagewood Dr
- 1084 E Sagewood Dr
- 1084 Sagewood Dr E
- 1087 E Sagewood Dr Unit 44
- 1087 E Sagewood Dr
- 1087 E Sagewood Dr
- 1080 E Sagewood Dr
- 1080 E Sagewood Dr
- 1080 E Sagewood Dr
- 1083 E Sagewood Dr
- 301 Wexford Place
- 300 Wexford Place
- 256 Buckingham Blvd
- 264 Buckingham Blvd
- 1076 E Sagewood Dr
- 248 Buckingham Blvd
- 272 Buckingham Blvd
- 305 Wexford Place
- 304 Wexford Place