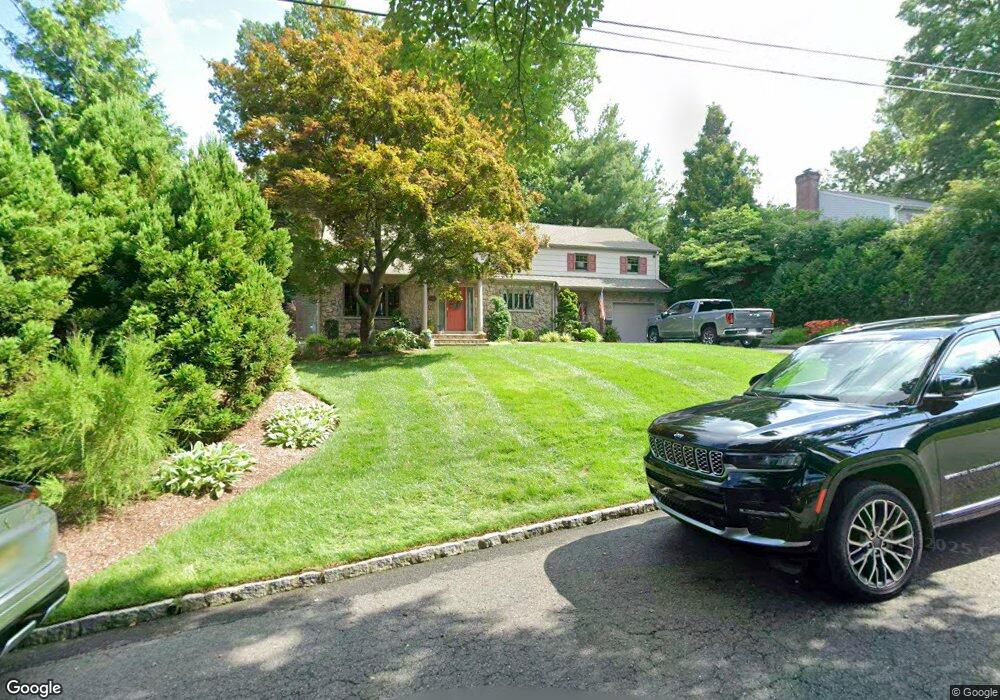
109 Abbey Ct Ramsey, NJ 07446
Estimated Value: $965,874 - $1,030,000
--
Bed
--
Bath
2,582
Sq Ft
$389/Sq Ft
Est. Value
About This Home
This home is located at 109 Abbey Ct, Ramsey, NJ 07446 and is currently estimated at $1,005,469, approximately $389 per square foot. 109 Abbey Ct is a home located in Bergen County with nearby schools including Ramsey High School.
Ownership History
Date
Name
Owned For
Owner Type
Purchase Details
Closed on
Feb 29, 2008
Sold by
Lagalia R Robert and Lagalia Denise
Bought by
Post Garrett G
Current Estimated Value
Home Financials for this Owner
Home Financials are based on the most recent Mortgage that was taken out on this home.
Original Mortgage
$679,000
Outstanding Balance
$424,367
Interest Rate
5.8%
Mortgage Type
New Conventional
Estimated Equity
$581,102
Purchase Details
Closed on
Sep 17, 2001
Sold by
Saladucha Bradley
Bought by
Malone Christopher and Malone Vanessa
Home Financials for this Owner
Home Financials are based on the most recent Mortgage that was taken out on this home.
Original Mortgage
$275,000
Interest Rate
6.91%
Create a Home Valuation Report for This Property
The Home Valuation Report is an in-depth analysis detailing your home's value as well as a comparison with similar homes in the area
Home Values in the Area
Average Home Value in this Area
Purchase History
| Date | Buyer | Sale Price | Title Company |
|---|---|---|---|
| Post Garrett G | $680,000 | -- | |
| Malone Christopher | $485,000 | -- |
Source: Public Records
Mortgage History
| Date | Status | Borrower | Loan Amount |
|---|---|---|---|
| Open | Post Garrett G | $679,000 | |
| Previous Owner | Malone Christopher | $275,000 |
Source: Public Records
Tax History Compared to Growth
Tax History
| Year | Tax Paid | Tax Assessment Tax Assessment Total Assessment is a certain percentage of the fair market value that is determined by local assessors to be the total taxable value of land and additions on the property. | Land | Improvement |
|---|---|---|---|---|
| 2025 | $17,759 | $839,100 | $353,400 | $485,700 |
| 2024 | $17,224 | $629,300 | $293,600 | $335,700 |
| 2023 | $16,507 | $629,300 | $293,600 | $335,700 |
| 2022 | $16,507 | $629,300 | $293,600 | $335,700 |
| 2021 | $5,061 | $629,300 | $293,600 | $335,700 |
| 2020 | $16,173 | $629,300 | $293,600 | $335,700 |
| 2019 | $15,468 | $629,300 | $293,600 | $335,700 |
| 2018 | $15,084 | $629,300 | $293,600 | $335,700 |
| 2017 | $14,801 | $629,300 | $293,600 | $335,700 |
| 2016 | $14,392 | $629,300 | $293,600 | $335,700 |
| 2015 | $13,494 | $499,600 | $288,900 | $210,700 |
| 2014 | $13,264 | $499,600 | $288,900 | $210,700 |
Source: Public Records
Map
Nearby Homes