109 Anita St Longview, TX 75603
Estimated Value: $200,000 - $267,000
--
Bed
2
Baths
1,821
Sq Ft
$126/Sq Ft
Est. Value
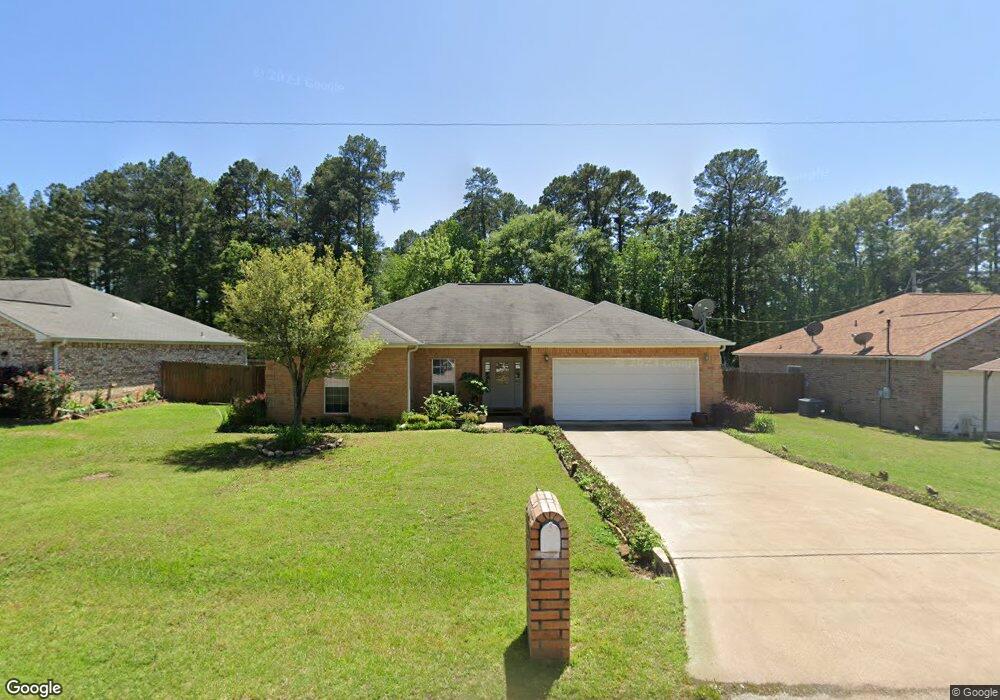
About This Home
This home is located at 109 Anita St, Longview, TX 75603 and is currently estimated at $230,188, approximately $126 per square foot. 109 Anita St is a home located in Gregg County with nearby schools including Ned E. Williams Elementary School.
Ownership History
Date
Name
Owned For
Owner Type
Purchase Details
Closed on
Aug 2, 2022
Sold by
Norman Billy C
Bought by
Norman Katz Holdings Llc
Current Estimated Value
Purchase Details
Closed on
Jul 15, 2022
Sold by
Billie Cleary-White
Bought by
Norman Billy C
Purchase Details
Closed on
Jul 14, 2022
Sold by
Billie Cleary-White
Bought by
Cleary-White Billie
Purchase Details
Closed on
Oct 23, 2007
Sold by
Mcmichael Development Inc
Bought by
Norman Billy
Create a Home Valuation Report for This Property
The Home Valuation Report is an in-depth analysis detailing your home's value as well as a comparison with similar homes in the area
Home Values in the Area
Average Home Value in this Area
Purchase History
| Date | Buyer | Sale Price | Title Company |
|---|---|---|---|
| Norman Katz Holdings Llc | -- | None Listed On Document | |
| Norman Billy C | -- | None Listed On Document | |
| Cleary-White Billie | -- | None Listed On Document | |
| Norman Billy | -- | Ctc |
Source: Public Records
Tax History Compared to Growth
Tax History
| Year | Tax Paid | Tax Assessment Tax Assessment Total Assessment is a certain percentage of the fair market value that is determined by local assessors to be the total taxable value of land and additions on the property. | Land | Improvement |
|---|---|---|---|---|
| 2025 | $4,880 | $250,060 | $7,500 | $242,560 |
| 2024 | $4,880 | $236,000 | $7,500 | $228,500 |
| 2023 | $4,633 | $228,660 | $7,500 | $221,160 |
| 2022 | $4,309 | $189,530 | $7,500 | $182,030 |
| 2021 | $3,917 | $164,670 | $7,500 | $157,170 |
| 2020 | $3,836 | $160,940 | $7,500 | $153,440 |
| 2019 | $3,909 | $159,310 | $7,500 | $151,810 |
| 2018 | $3,838 | $158,040 | $7,500 | $150,540 |
| 2017 | $3,642 | $148,320 | $7,500 | $140,820 |
| 2016 | $3,646 | $148,470 | $7,500 | $140,970 |
| 2015 | $3,668 | $149,360 | $7,500 | $141,860 |
| 2014 | -- | $150,190 | $7,500 | $142,690 |
Source: Public Records
Map
Nearby Homes