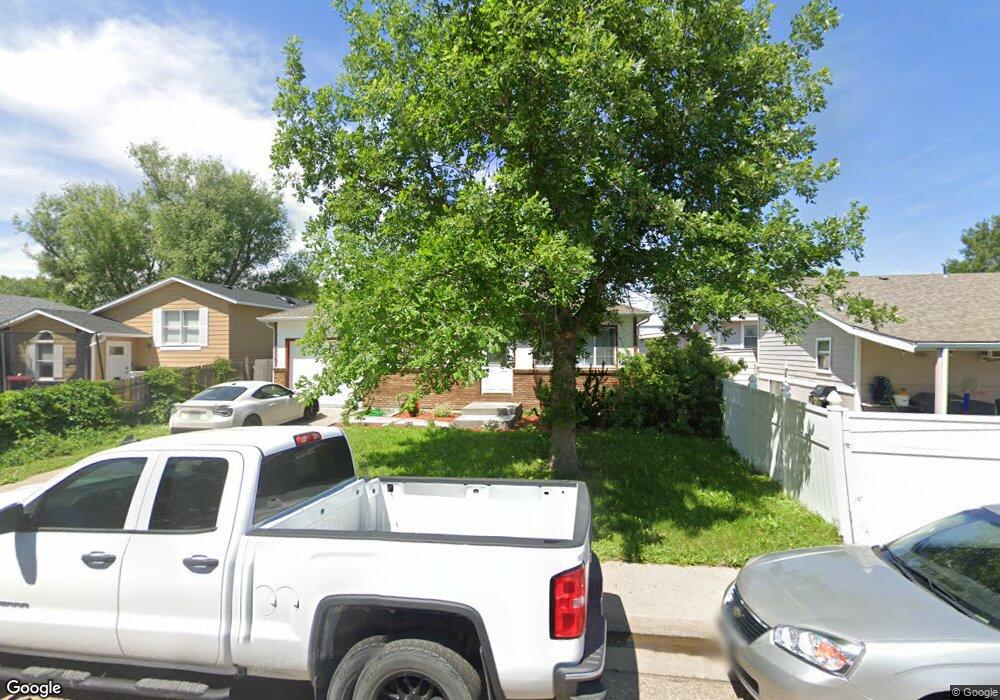
109 Ash St Fort Morgan, CO 80701
Estimated Value: $304,000 - $313,931
3
Beds
1
Bath
1,014
Sq Ft
$305/Sq Ft
Est. Value
About This Home
This home is located at 109 Ash St, Fort Morgan, CO 80701 and is currently estimated at $308,983, approximately $304 per square foot. 109 Ash St is a home located in Morgan County with nearby schools including Fort Morgan High School and Lighthouse Seventh-day Adventist Christian School.
Ownership History
Date
Name
Owned For
Owner Type
Purchase Details
Closed on
Sep 30, 2011
Sold by
Groves Kyle R and Renka Katie E
Bought by
Davisson Shane
Current Estimated Value
Home Financials for this Owner
Home Financials are based on the most recent Mortgage that was taken out on this home.
Original Mortgage
$107,772
Outstanding Balance
$73,999
Interest Rate
4.24%
Mortgage Type
New Conventional
Estimated Equity
$234,984
Purchase Details
Closed on
Apr 18, 2011
Sold by
Johnson Betty J and Johnson Betty
Bought by
Bieber Jacob M and Bieber Vasiliki I
Purchase Details
Closed on
Oct 5, 2007
Sold by
Leon Eli L
Bought by
U S Bank Na
Create a Home Valuation Report for This Property
The Home Valuation Report is an in-depth analysis detailing your home's value as well as a comparison with similar homes in the area
Home Values in the Area
Average Home Value in this Area
Purchase History
| Date | Buyer | Sale Price | Title Company |
|---|---|---|---|
| Davisson Shane | $104,000 | None Available | |
| Bieber Jacob M | -- | None Available | |
| U S Bank Na | -- | None Available |
Source: Public Records
Mortgage History
| Date | Status | Borrower | Loan Amount |
|---|---|---|---|
| Open | Davisson Shane | $107,772 |
Source: Public Records
Tax History Compared to Growth
Tax History
| Year | Tax Paid | Tax Assessment Tax Assessment Total Assessment is a certain percentage of the fair market value that is determined by local assessors to be the total taxable value of land and additions on the property. | Land | Improvement |
|---|---|---|---|---|
| 2024 | $1,407 | $17,570 | $1,970 | $15,600 |
| 2023 | $1,407 | $21,260 | $2,390 | $18,870 |
| 2022 | $1,178 | $14,370 | $2,340 | $12,030 |
| 2021 | $1,212 | $14,770 | $2,400 | $12,370 |
| 2020 | $1,139 | $13,510 | $2,290 | $11,220 |
| 2019 | $1,141 | $13,510 | $2,290 | $11,220 |
| 2018 | $908 | $10,600 | $1,900 | $8,700 |
| 2017 | $909 | $10,600 | $1,900 | $8,700 |
| 2016 | $853 | $9,850 | $2,290 | $7,560 |
| 2015 | $841 | $9,850 | $2,290 | $7,560 |
| 2014 | $781 | $8,920 | $2,040 | $6,880 |
| 2013 | -- | $8,920 | $2,040 | $6,880 |
Source: Public Records
Map
Nearby Homes