Estimated Value: $122,000
--
Bed
--
Bath
55,221
Sq Ft
$2/Sq Ft
Est. Value
About This Home
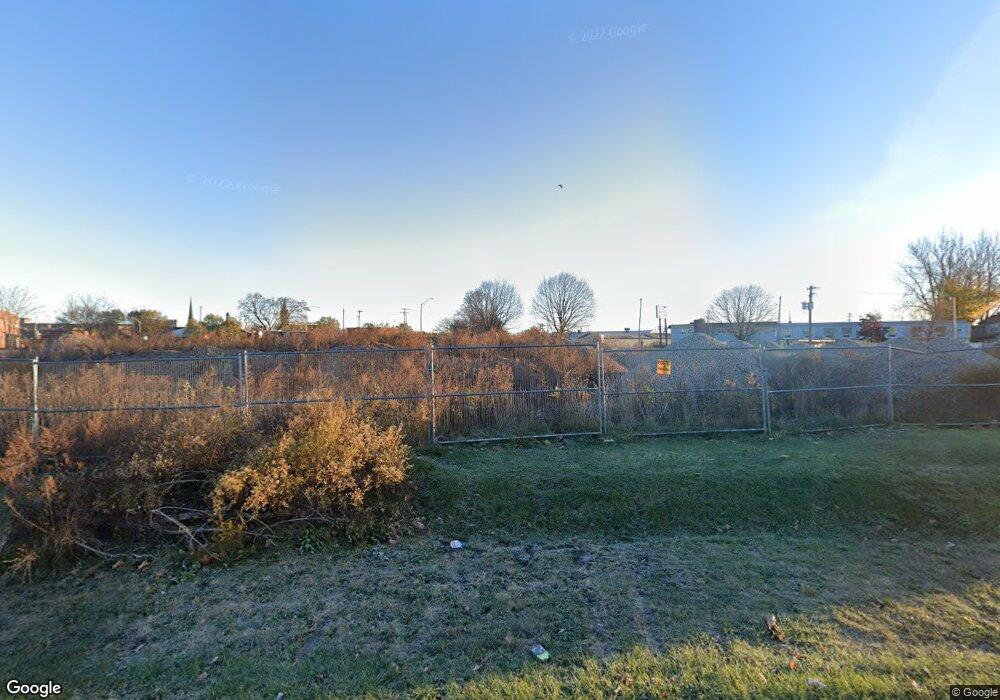
This home is located at 109 Canal St, Rome, NY 13440 and is currently priced at $122,000, approximately $2 per square foot. 109 Canal St is a home located in Oneida County with nearby schools including George R. Staley Upper Elementary School, Bellamy Elementary School, and Lyndon H. Strough Middle School.
Ownership History
Date
Name
Owned For
Owner Type
Purchase Details
Closed on
Aug 17, 2010
Sold by
Russitano
Bought by
Hoke Ricky
Current Estimated Value
Home Financials for this Owner
Home Financials are based on the most recent Mortgage that was taken out on this home.
Original Mortgage
$500,000
Interest Rate
4.36%
Mortgage Type
Commercial
Purchase Details
Closed on
Dec 31, 2007
Sold by
Rofin Llc
Bought by
Rollerad Corporation
Purchase Details
Closed on
Aug 30, 2006
Sold by
Rorrep Llc
Bought by
Rofin Llc
Create a Home Valuation Report for This Property
The Home Valuation Report is an in-depth analysis detailing your home's value as well as a comparison with similar homes in the area
Home Values in the Area
Average Home Value in this Area
Purchase History
| Date | Buyer | Sale Price | Title Company |
|---|---|---|---|
| Hoke Ricky | -- | John Panzone | |
| Rollerad Corporation | $150,000 | Gustave J Detraglia | |
| Rofin Llc | $125,000 | Joseph S Deery |
Source: Public Records
Mortgage History
| Date | Status | Borrower | Loan Amount |
|---|---|---|---|
| Previous Owner | Hoke Ricky | $500,000 |
Source: Public Records
Tax History Compared to Growth
Tax History
| Year | Tax Paid | Tax Assessment Tax Assessment Total Assessment is a certain percentage of the fair market value that is determined by local assessors to be the total taxable value of land and additions on the property. | Land | Improvement |
|---|---|---|---|---|
| 2024 | -- | $30,000 | $30,000 | $0 |
| 2023 | -- | $30,000 | $30,000 | $0 |
| 2022 | $0 | $30,000 | $30,000 | $0 |
| 2021 | $0 | $30,000 | $30,000 | $0 |
| 2020 | $0 | $30,000 | $30,000 | $0 |
| 2019 | $0 | $85,000 | $30,000 | $55,000 |
| 2018 | $0 | $85,000 | $30,000 | $55,000 |
| 2017 | $0 | $85,000 | $30,000 | $55,000 |
| 2016 | $0 | $85,000 | $30,000 | $55,000 |
| 2015 | -- | $85,000 | $30,000 | $55,000 |
| 2014 | -- | $85,000 | $30,000 | $55,000 |
Source: Public Records
Map
Nearby Homes