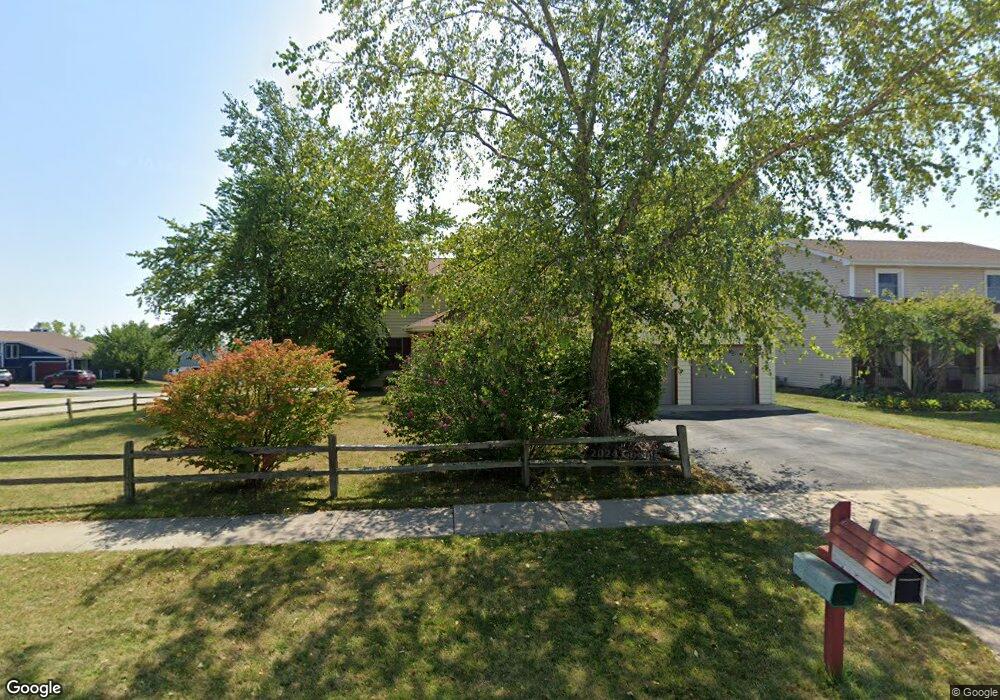
109 Juniper Way Lake Villa, IL 60046
South Lake Villa NeighborhoodEstimated Value: $402,158 - $415,000
3
Beds
3
Baths
2,040
Sq Ft
$199/Sq Ft
Est. Value
About This Home
This home is located at 109 Juniper Way, Lake Villa, IL 60046 and is currently estimated at $406,540, approximately $199 per square foot. 109 Juniper Way is a home located in Lake County with nearby schools including Olive C Martin School, Palombi Middle School, and Lakes Community High School.
Ownership History
Date
Name
Owned For
Owner Type
Purchase Details
Closed on
Apr 23, 2001
Sold by
Young M Randi
Bought by
Clements Brian W and Clements Karen W
Current Estimated Value
Home Financials for this Owner
Home Financials are based on the most recent Mortgage that was taken out on this home.
Original Mortgage
$208,050
Outstanding Balance
$76,524
Interest Rate
6.99%
Estimated Equity
$330,016
Purchase Details
Closed on
Mar 23, 2001
Sold by
Young Steven W
Bought by
Young M Randi
Home Financials for this Owner
Home Financials are based on the most recent Mortgage that was taken out on this home.
Original Mortgage
$208,050
Outstanding Balance
$76,524
Interest Rate
6.99%
Estimated Equity
$330,016
Purchase Details
Closed on
Jun 20, 1996
Sold by
State Bank Of The Lakes
Bought by
Young Steve and Young Randi M
Home Financials for this Owner
Home Financials are based on the most recent Mortgage that was taken out on this home.
Original Mortgage
$163,600
Interest Rate
8.07%
Create a Home Valuation Report for This Property
The Home Valuation Report is an in-depth analysis detailing your home's value as well as a comparison with similar homes in the area
Home Values in the Area
Average Home Value in this Area
Purchase History
| Date | Buyer | Sale Price | Title Company |
|---|---|---|---|
| Clements Brian W | $219,000 | Chicago Title Insurance Co | |
| Young M Randi | -- | -- | |
| Young Steve | $205,000 | -- |
Source: Public Records
Mortgage History
| Date | Status | Borrower | Loan Amount |
|---|---|---|---|
| Open | Clements Brian W | $208,050 | |
| Previous Owner | Young Steve | $163,600 |
Source: Public Records
Tax History Compared to Growth
Tax History
| Year | Tax Paid | Tax Assessment Tax Assessment Total Assessment is a certain percentage of the fair market value that is determined by local assessors to be the total taxable value of land and additions on the property. | Land | Improvement |
|---|---|---|---|---|
| 2024 | $9,068 | $106,642 | $17,394 | $89,248 |
| 2023 | $8,756 | $94,223 | $15,368 | $78,855 |
| 2022 | $8,756 | $86,778 | $14,309 | $72,469 |
| 2021 | $8,314 | $80,611 | $13,292 | $67,319 |
| 2020 | $8,133 | $78,028 | $12,866 | $65,162 |
| 2019 | $8,780 | $74,991 | $12,365 | $62,626 |
| 2018 | $9,216 | $82,107 | $18,249 | $63,858 |
| 2017 | $8,930 | $79,917 | $17,762 | $62,155 |
| 2016 | $9,050 | $76,681 | $17,043 | $59,638 |
| 2015 | $8,716 | $71,618 | $15,918 | $55,700 |
| 2014 | $8,073 | $71,228 | $16,456 | $54,772 |
| 2012 | $7,444 | $71,571 | $16,535 | $55,036 |
Source: Public Records
Map
Nearby Homes
- 104 Oak Knoll Dr
- 116 E Monaville Rd
- 355 Woodhill Ln
- 37756 N Cedar Lake Rd
- 37782 N Cedar Lake Rd
- 2651 N Cherry Cove Ln
- 0 Park Ave
- 22271 W Terry Dr S
- 21210 W Grass Lake Rd
- 2526 Acorn Dr
- 390 E Quaker Hollow Ln
- 18 Sheehan Dr
- 330 Greenview Ln
- 802 Apache Trail
- 21974 W Engle Dr
- 81 W Dahlia Ln
- 36915 N Mary Dr
- 2380 N Salem Ln
- 349 E Springwood Ct
- 36664 N Helen Dr
- 97 Juniper Way
- 622 Mckinley Ave
- 87 Juniper Way
- 125 Juniper Ct
- 108 Juniper Way
- 638 Mckinley Ave
- 120 Juniper Way
- 96 Juniper Way
- 623 Mckinley Ave
- 637 Mckinley Ave
- 627 Pine View Pass
- 73 Juniper Way
- 84 Juniper Way
- 129 Juniper Ct
- 639 Pine View Pass
- 653 Mckinley Ave
- 72 Juniper Way
- 98 Red Spruce Trail
- 107 White Pine Ln
- 128 Juniper Ct