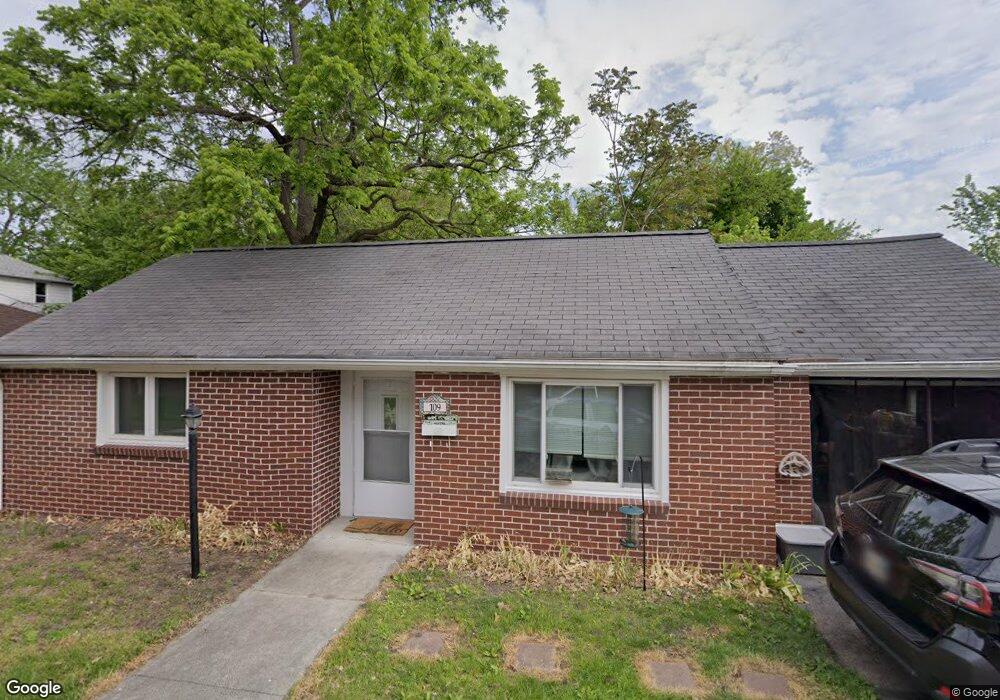
109 Kramer Ln Bowling Green, OH 43402
Estimated Value: $133,368 - $173,000
2
Beds
1
Bath
747
Sq Ft
$198/Sq Ft
Est. Value
About This Home
This home is located at 109 Kramer Ln, Bowling Green, OH 43402 and is currently estimated at $148,092, approximately $198 per square foot. 109 Kramer Ln is a home located in Wood County with nearby schools including Bowling Green High School, Montessori School Of Bowling Green, and Bowling Green Christian Academy.
Ownership History
Date
Name
Owned For
Owner Type
Purchase Details
Closed on
Jun 17, 2025
Sold by
Mcveigh James P and Mcveigh Jennifer R
Bought by
Mcveigh James P and Mcveigh Jennifer R
Current Estimated Value
Purchase Details
Closed on
Feb 8, 2002
Sold by
Grine Robert J and Grine Pamela J
Bought by
Mcveigh James
Home Financials for this Owner
Home Financials are based on the most recent Mortgage that was taken out on this home.
Original Mortgage
$60,000
Interest Rate
7.23%
Purchase Details
Closed on
Jun 29, 2000
Sold by
Brough Dorothy M
Bought by
Grine Robert J and Grine Pamela J
Home Financials for this Owner
Home Financials are based on the most recent Mortgage that was taken out on this home.
Original Mortgage
$44,000
Interest Rate
8.66%
Purchase Details
Closed on
Feb 9, 1979
Bought by
Brough Dorothy M
Create a Home Valuation Report for This Property
The Home Valuation Report is an in-depth analysis detailing your home's value as well as a comparison with similar homes in the area
Home Values in the Area
Average Home Value in this Area
Purchase History
| Date | Buyer | Sale Price | Title Company |
|---|---|---|---|
| Mcveigh James P | -- | None Listed On Document | |
| Mcveigh James | $75,000 | American Title Agency | |
| Grine Robert J | $55,000 | American Title Agency | |
| Brough Dorothy M | -- | -- |
Source: Public Records
Mortgage History
| Date | Status | Borrower | Loan Amount |
|---|---|---|---|
| Previous Owner | Mcveigh James | $60,000 | |
| Previous Owner | Grine Robert J | $44,000 |
Source: Public Records
Tax History Compared to Growth
Tax History
| Year | Tax Paid | Tax Assessment Tax Assessment Total Assessment is a certain percentage of the fair market value that is determined by local assessors to be the total taxable value of land and additions on the property. | Land | Improvement |
|---|---|---|---|---|
| 2024 | $1,499 | $34,755 | $6,860 | $27,895 |
| 2023 | $1,499 | $34,760 | $6,860 | $27,900 |
| 2021 | $1,169 | $26,990 | $5,710 | $21,280 |
| 2020 | $1,164 | $26,990 | $5,710 | $21,280 |
| 2019 | $1,142 | $25,070 | $5,710 | $19,360 |
| 2018 | $1,135 | $25,070 | $5,710 | $19,360 |
| 2017 | $1,122 | $25,070 | $5,710 | $19,360 |
| 2016 | $1,019 | $22,650 | $5,990 | $16,660 |
| 2015 | $1,019 | $22,650 | $5,990 | $16,660 |
| 2014 | $1,057 | $22,650 | $5,990 | $16,660 |
| 2013 | $1,084 | $21,570 | $5,710 | $15,860 |
Source: Public Records
Map
Nearby Homes
- Lot 36 S Prospect St
- Lot 41 S Prospect St
- Lot 40 S Prospect St
- 448 S Church St
- 518 S Grove St
- 608 S Summit St
- 210 W Wooster St
- 519 Knollwood Dr
- 545 Wallace Ave
- 0 Haskins Rd Unit 6132516
- 4 Mackenzie Ct
- 7 Augusta Dr Unit 7
- 893 W Wooster St
- 733 Conneaut Ave
- 1024 Clark St
- 14732 Sand Ridge Rd
- 14580 Sand Ridge Rd
- 8 Arlington Ct
- 535 W Gypsy Lane Rd
- 1025 Indian Ridge Dr
- 105 Kramer Ln
- 0 Kramer Ln
- 415 S Main St
- 421 S Main St
- 101 Kramer Ln
- 121 Palmer Ave
- 121 Palmer Ave
- 131 Palmer Ave
- 409 S Main St
- 438 S Prospect St
- 127 Palmer Ave
- 137 Palmer Ave
- 403 S Main St
- 126 Lehman Ave Unit 128
- 122 Lehman Ave
- 431 S Prospect St
- 0 Lehman Ave
- 408 S Prospect St
- 439 S Prospect St
- 439 S Prospect St