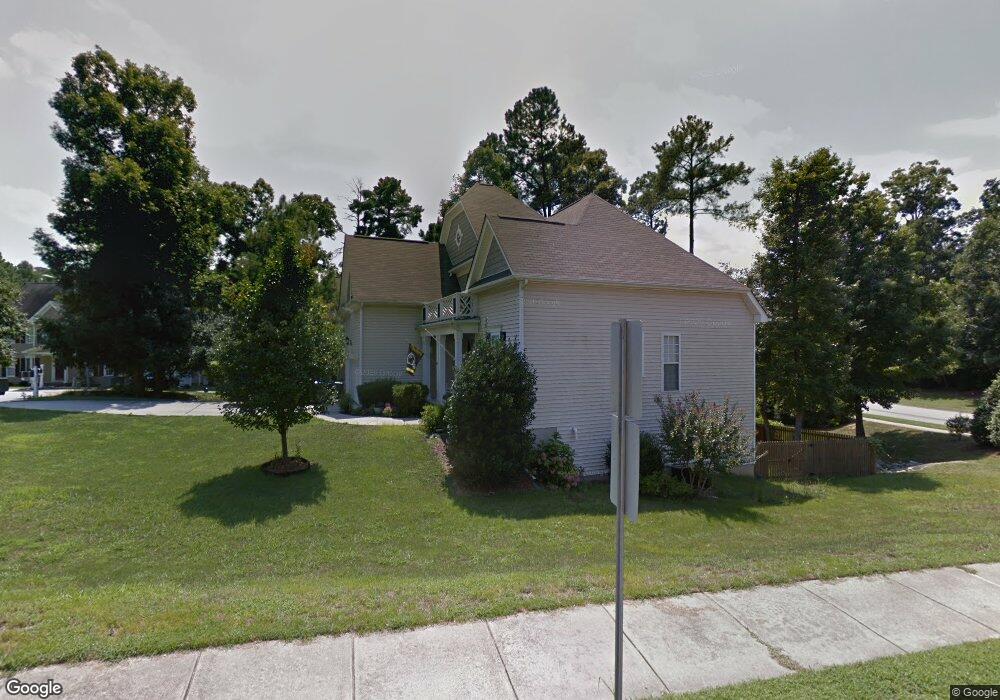
109 Meadow Springs Ct Holly Springs, NC 27540
Estimated Value: $491,276 - $528,000
4
Beds
3
Baths
2,268
Sq Ft
$223/Sq Ft
Est. Value
About This Home
This home is located at 109 Meadow Springs Ct, Holly Springs, NC 27540 and is currently estimated at $505,319, approximately $222 per square foot. 109 Meadow Springs Ct is a home located in Wake County with nearby schools including Holly Grove Elementary School, Holly Grove Middle School, and Holly Springs High School.
Ownership History
Date
Name
Owned For
Owner Type
Purchase Details
Closed on
May 9, 2013
Sold by
Leroy Jeffrey J and Leroy Kathleen G
Bought by
Martin Marcia K and Martin Matthew S
Current Estimated Value
Home Financials for this Owner
Home Financials are based on the most recent Mortgage that was taken out on this home.
Original Mortgage
$230,743
Outstanding Balance
$170,080
Interest Rate
4.4%
Mortgage Type
FHA
Estimated Equity
$335,239
Purchase Details
Closed on
Jul 31, 2001
Sold by
Sanderling Construction Inc
Bought by
Leroy Jeffrey J and Leroy Kathleen G
Home Financials for this Owner
Home Financials are based on the most recent Mortgage that was taken out on this home.
Original Mortgage
$185,400
Interest Rate
7.09%
Mortgage Type
Balloon
Purchase Details
Closed on
Apr 3, 2000
Sold by
Covenant Developers Llc
Bought by
Sanderling Homes & Construction Inc
Home Financials for this Owner
Home Financials are based on the most recent Mortgage that was taken out on this home.
Original Mortgage
$22,500
Interest Rate
8.34%
Mortgage Type
Construction
Create a Home Valuation Report for This Property
The Home Valuation Report is an in-depth analysis detailing your home's value as well as a comparison with similar homes in the area
Home Values in the Area
Average Home Value in this Area
Purchase History
| Date | Buyer | Sale Price | Title Company |
|---|---|---|---|
| Martin Marcia K | $235,000 | None Available | |
| Leroy Jeffrey J | $206,000 | -- | |
| Sanderling Construction Inc | -- | -- | |
| Sanderling Homes & Construction Inc | $30,000 | -- |
Source: Public Records
Mortgage History
| Date | Status | Borrower | Loan Amount |
|---|---|---|---|
| Open | Martin Marcia K | $230,743 | |
| Previous Owner | Sanderling Construction Inc | $185,400 | |
| Previous Owner | Sanderling Homes & Construction Inc | $22,500 |
Source: Public Records
Tax History Compared to Growth
Tax History
| Year | Tax Paid | Tax Assessment Tax Assessment Total Assessment is a certain percentage of the fair market value that is determined by local assessors to be the total taxable value of land and additions on the property. | Land | Improvement |
|---|---|---|---|---|
| 2025 | $3,937 | $455,154 | $115,000 | $340,154 |
| 2024 | $3,921 | $455,154 | $115,000 | $340,154 |
| 2023 | $3,337 | $307,543 | $52,000 | $255,543 |
| 2022 | $3,222 | $307,543 | $52,000 | $255,543 |
| 2021 | $3,162 | $307,543 | $52,000 | $255,543 |
| 2020 | $3,162 | $307,543 | $52,000 | $255,543 |
| 2019 | $3,319 | $274,202 | $52,000 | $222,202 |
| 2018 | $3,000 | $274,202 | $52,000 | $222,202 |
| 2017 | $2,892 | $274,202 | $52,000 | $222,202 |
| 2016 | $2,853 | $274,202 | $52,000 | $222,202 |
| 2015 | $3,041 | $287,850 | $52,000 | $235,850 |
| 2014 | $2,936 | $287,850 | $52,000 | $235,850 |
Source: Public Records
Map
Nearby Homes
- 233 Hickory Glen Ln
- 161 Summit Oaks Ln
- 100 Avent Pines Ln
- 208 Autumn Glen Ln
- 933 Hollymont Dr
- 1712 Avent Ferry Rd
- 101 Covenant Rock Ln
- 505 Pyracantha Dr
- 213 Holly Moor Ln
- 341 Covenant Rock Ln
- 300 Shorehouse Way
- 304 Magnolia Meadow Way
- 417 Shorehouse Way
- 100 Oakmoss Trail
- 0 Old Airport Rd
- 113 Braxman Ln
- 425 Cahors Trail
- 104 Pointe Park Cir
- 108 Pointe Park Cir
- 305 Tonks Trail
- 105 Meadow Springs Ct
- 600 Wild Holly Ln
- 101 Meadow Springs Ct
- 513 Wild Holly Ln
- 100 Meadow Springs Ct
- 508 Wild Holly Ln
- 309 Holly Green Ln
- 101 Maple Glen Ln
- 504 Wild Holly Ln
- 313 Holly Green Ln
- 509 Wild Holly Ln
- 217 High Maple Ct
- 213 High Maple Ct
- 105 Maple Glen Ln
- 305 Holly Green Ln
- 505 Wild Holly Ln
- 209 High Maple Ct
- 201 High Maple Ct
- 221 High Maple Ct
- 228 Avent Pines Ln