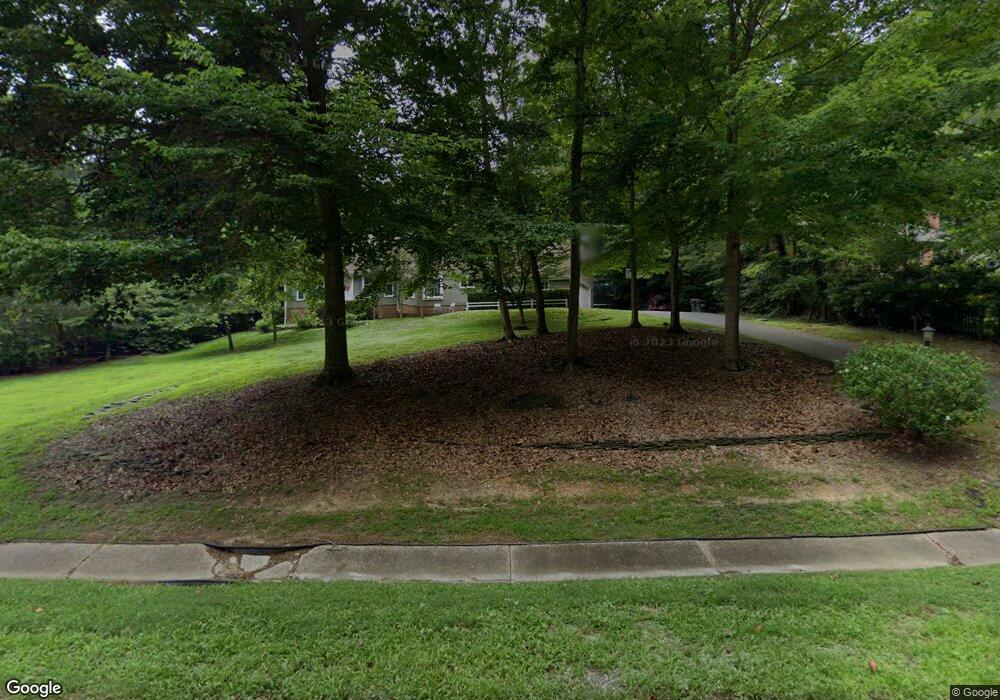
109 Montague Cr York County, VA 23185
York Terrace NeighborhoodEstimated Value: $573,265 - $622,000
4
Beds
3
Baths
2,795
Sq Ft
$215/Sq Ft
Est. Value
About This Home
This home is located at 109 Montague Cr, York County, VA 23185 and is currently estimated at $601,066, approximately $215 per square foot. 109 Montague Cr is a home located in York County with nearby schools including Magruder Elementary School, Queens Lake Middle School, and Bruton High School.
Ownership History
Date
Name
Owned For
Owner Type
Purchase Details
Closed on
May 15, 2018
Sold by
Rice Jason A
Bought by
Marquart Gregory Dean and Marquart April
Current Estimated Value
Home Financials for this Owner
Home Financials are based on the most recent Mortgage that was taken out on this home.
Original Mortgage
$369,000
Outstanding Balance
$317,721
Interest Rate
4.4%
Mortgage Type
New Conventional
Estimated Equity
$283,345
Purchase Details
Closed on
Dec 27, 2016
Sold by
Rice Jason A and Rice Natalie E
Bought by
Rice Jason A
Purchase Details
Closed on
Dec 28, 2011
Sold by
Saunders Nancy Adams
Bought by
Rice Jason A
Home Financials for this Owner
Home Financials are based on the most recent Mortgage that was taken out on this home.
Original Mortgage
$248,400
Interest Rate
4%
Mortgage Type
VA
Create a Home Valuation Report for This Property
The Home Valuation Report is an in-depth analysis detailing your home's value as well as a comparison with similar homes in the area
Home Values in the Area
Average Home Value in this Area
Purchase History
| Date | Buyer | Sale Price | Title Company |
|---|---|---|---|
| Marquart Gregory Dean | $410,000 | Sage Title Group Llc | |
| Rice Jason A | -- | None Available | |
| Rice Jason A | $240,500 | -- |
Source: Public Records
Mortgage History
| Date | Status | Borrower | Loan Amount |
|---|---|---|---|
| Open | Marquart Gregory Dean | $369,000 | |
| Previous Owner | Rice Jason A | $248,400 |
Source: Public Records
Tax History Compared to Growth
Tax History
| Year | Tax Paid | Tax Assessment Tax Assessment Total Assessment is a certain percentage of the fair market value that is determined by local assessors to be the total taxable value of land and additions on the property. | Land | Improvement |
|---|---|---|---|---|
| 2025 | $3,409 | $460,700 | $130,000 | $330,700 |
| 2024 | $3,409 | $460,700 | $130,000 | $330,700 |
| 2023 | $3,058 | $397,100 | $130,000 | $267,100 |
| 2022 | $3,097 | $397,100 | $130,000 | $267,100 |
| 2021 | $3,097 | $389,500 | $127,000 | $262,500 |
| 2020 | $3,097 | $389,500 | $127,000 | $262,500 |
| 2019 | $3,920 | $343,900 | $127,000 | $216,900 |
| 2018 | $3,920 | $343,900 | $127,000 | $216,900 |
| 2017 | $2,584 | $343,900 | $127,000 | $216,900 |
| 2016 | -- | $343,900 | $127,000 | $216,900 |
| 2015 | -- | $356,200 | $130,000 | $226,200 |
| 2014 | -- | $352,800 | $130,000 | $222,800 |
Source: Public Records
Map
Nearby Homes
- 105 Sherwood Dr
- 124 Holcomb Dr
- 132 Bowstring Dr
- 105 Corvette Dr
- 111 Corvette Dr
- 806 Queensbury Ln
- 101 Lakeshead Dr
- 100 Merchant Man Ct
- 110 Yardarm Ct
- 307 Cobble Stone
- 102 Springfield Dr
- 112 Queen Anne Dr
- 308 Royal Grant Dr
- 108 Burgundy Rd
- 175 Sheppard Dr
- 504 Hubbard Ln
- 608 Musket Dr
- 119 Golden Bear Cir
- 105 Glenn Cir
- 994 Wilkins Dr
- 109 Montague Cir
- 107 Montague Cir
- 111 Montague Cir
- 256 E Queens Dr
- 110 Montague Cir
- 254 E Queens Dr
- 258 E Queens Dr
- 108 Montague Cir
- 105 Montague Cir
- 115 Montague Cir
- 112 Montague Cir
- 260 E Queens Dr
- 106 Montague Cir
- 114 Montague Cir
- 252 E Queens Dr
- 103 Montague Cir
- 257 E Queens Dr
- 102 Horseshoe Dr
- 142 Horseshoe Dr
- 111 Charles River