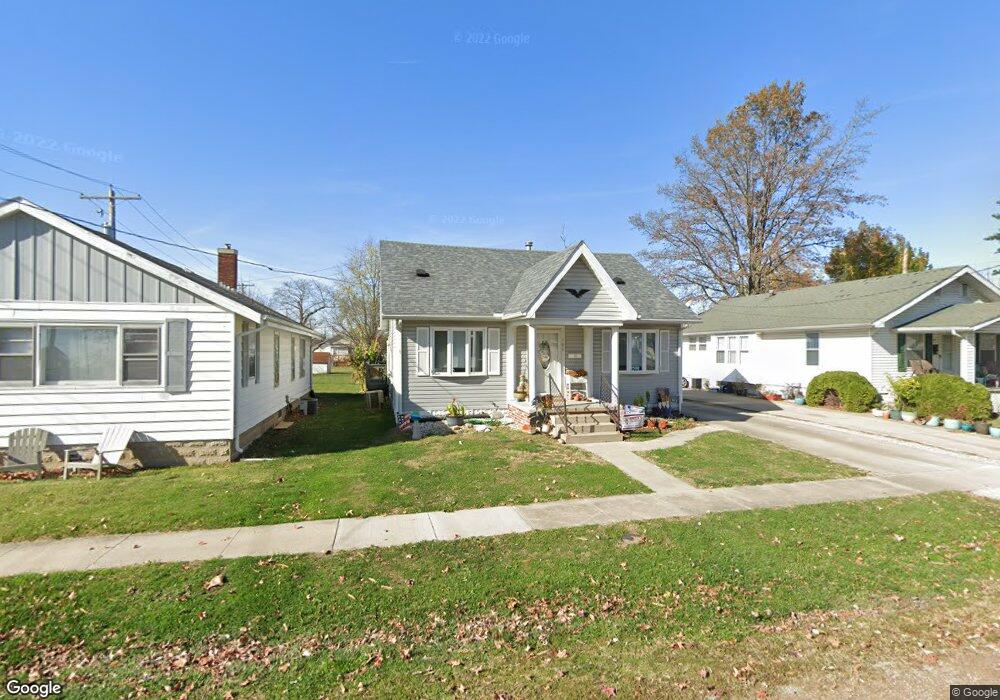
109 N Oak St Effingham, IL 62401
Estimated Value: $123,000 - $524,000
3
Beds
2
Baths
1,200
Sq Ft
$193/Sq Ft
Est. Value
About This Home
Nice home in good, central location in Effingham. Home has a large, 2 car detached garage and large back deck, as well as a decent sized yard. The main level features the kitchen, dining, master bedroom with walk in closet, and large bathroom. Upstairs is an open area that could be used as 2 separate bedrooms, office area, playroom, etc. Downstairs has large open area, full bathroom, additional bedroom, and laundry room.
Tenant pays all utilities and handles lawn care. One year lease. No Pets. No Smoking inside. $1,450/mo $1,450 deposit with 1 year lease ($2,900 due at signing). If interested, please submit an application using the "Apply" button. "Request Tour" will be ignored.
Ownership History
Date
Name
Owned For
Owner Type
Purchase Details
Closed on
Dec 27, 2023
Sold by
Thacker Holly M and Thacker Cody
Bought by
Piggy Bank Investment Properties Llc
Current Estimated Value
Purchase Details
Closed on
Feb 24, 2010
Sold by
Robertson Michael D and Estate Of Laurian W Robertson
Bought by
Witte Holly M
Home Financials for this Owner
Home Financials are based on the most recent Mortgage that was taken out on this home.
Original Mortgage
$91,836
Interest Rate
5.01%
Mortgage Type
Purchase Money Mortgage
Create a Home Valuation Report for This Property
The Home Valuation Report is an in-depth analysis detailing your home's value as well as a comparison with similar homes in the area
Home Values in the Area
Average Home Value in this Area
Purchase History
| Date | Buyer | Sale Price | Title Company |
|---|---|---|---|
| Piggy Bank Investment Properties Llc | -- | None Listed On Document | |
| Witte Holly M | -- | None Available |
Source: Public Records
Mortgage History
| Date | Status | Borrower | Loan Amount |
|---|---|---|---|
| Previous Owner | Witte Holly M | $91,836 |
Source: Public Records
Property History
| Date | Event | Price | List to Sale | Price per Sq Ft |
|---|---|---|---|---|
| 04/30/2025 04/30/25 | Off Market | $1,450 | -- | -- |
| 04/01/2025 04/01/25 | Price Changed | $1,450 | -6.5% | $1 / Sq Ft |
| 03/29/2025 03/29/25 | For Rent | $1,550 | -- | -- |
Tax History Compared to Growth
Tax History
| Year | Tax Paid | Tax Assessment Tax Assessment Total Assessment is a certain percentage of the fair market value that is determined by local assessors to be the total taxable value of land and additions on the property. | Land | Improvement |
|---|---|---|---|---|
| 2024 | $2,477 | $36,660 | $7,270 | $29,390 |
| 2023 | $1,861 | $33,330 | $6,610 | $26,720 |
| 2022 | $3,041 | $49,550 | $6,060 | $43,490 |
| 2021 | $3,123 | $49,060 | $6,000 | $43,060 |
| 2020 | $3,055 | $47,680 | $5,830 | $41,850 |
| 2019 | $2,993 | $47,210 | $5,770 | $41,440 |
| 2018 | $2,879 | $45,400 | $5,550 | $39,850 |
| 2017 | $2,821 | $44,510 | $5,440 | $39,070 |
| 2016 | $2,749 | $43,210 | $5,280 | $37,930 |
| 2015 | -- | $41,960 | $5,130 | $36,830 |
| 2014 | -- | $40,740 | $4,980 | $35,760 |
| 2013 | -- | $39,940 | $4,880 | $35,060 |
| 2012 | -- | $39,350 | $4,810 | $34,540 |
Source: Public Records
Map
Nearby Homes
- 702 W Fayette Ave
- 710 W Richland Ave
- 0 Augusta National Dr Unit 6255461
- 0 S Lakewood Dr
- 407 W Edgar Ave
- 601 S Maple St
- 406 W Kentucky Ave
- 1600 W Fayette Ave
- 602 S 5th St
- 1006 N Koester Dr
- 100 E Temple Ave
- 812 S 4th St
- 1105 N Merchant St
- 505 W Evergreen Ave
- 104 S Willow St
- 603 E Saint Louis Ave
- 1005 S 3rd St
- 801 N Cleveland St
- 1201 N Martin St
- 805 N Glenwood St
- 107 N Oak St
- 111 N Oak St
- 1002 W Jefferson Ave
- 108 N Vine St
- 106 N Vine St
- 110 N Vine St
- 1000 W Franklin Ave
- 1002 W Franklin Ave
- 1006 W Jefferson Ave
- 912 W Franklin Ave
- 108 N Oak St
- 1004 W Franklin Ave
- 110 N Oak St
- 106 N Oak St
- 1008 W Jefferson Ave
- 910 W Franklin Ave
- 1006 W Franklin Ave
- 908 W Jefferson Ave
- 908 W Franklin Ave
- 7 S Oak St