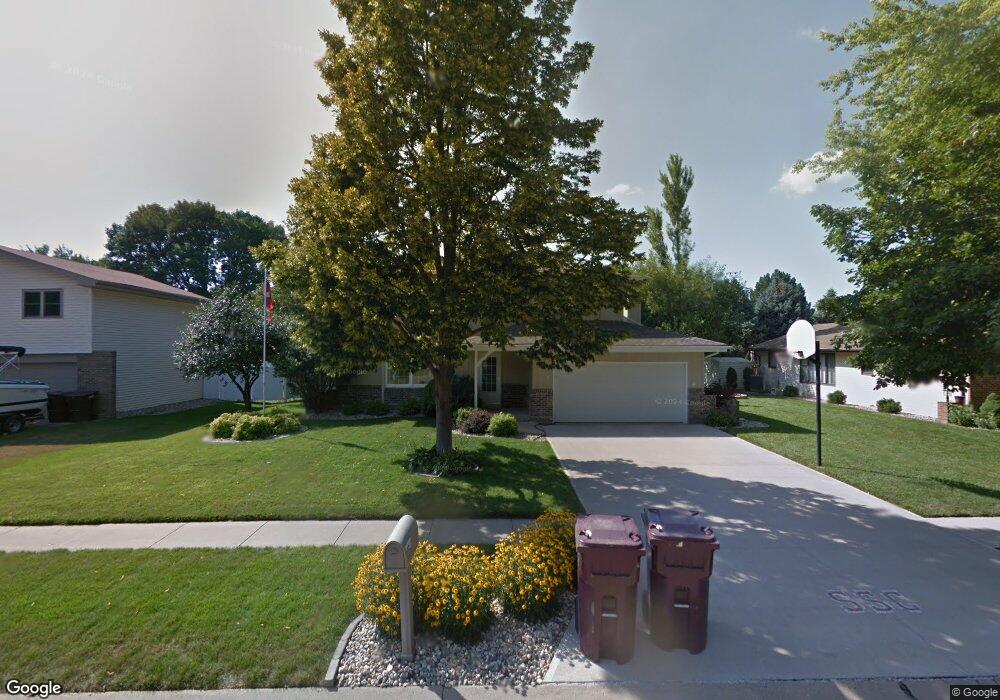
109 Parkview Dr South Sioux City, NE 68776
Estimated Value: $275,077 - $315,000
4
Beds
3
Baths
1,948
Sq Ft
$155/Sq Ft
Est. Value
About This Home
This home is located at 109 Parkview Dr, South Sioux City, NE 68776 and is currently estimated at $302,019, approximately $155 per square foot. 109 Parkview Dr is a home located in Dakota County with nearby schools including Covington Elementary School, South Sioux City Middle School, and South Sioux Senior High School.
Ownership History
Date
Name
Owned For
Owner Type
Purchase Details
Closed on
Jun 11, 2019
Sold by
Harsma Jeffery J and Harsma Bobbi Jo L
Bought by
Chrisman Robert Jw and Chrisman Guadalupe
Current Estimated Value
Home Financials for this Owner
Home Financials are based on the most recent Mortgage that was taken out on this home.
Original Mortgage
$213,150
Outstanding Balance
$187,411
Interest Rate
4.1%
Mortgage Type
New Conventional
Estimated Equity
$114,608
Purchase Details
Closed on
Oct 28, 2005
Sold by
Federal National Mortgage Association
Bought by
Harsma Jeffrey J and Harsma Bobbie Jo L
Purchase Details
Closed on
Feb 24, 2005
Sold by
Dodds Richard E and Dodds Paula A
Bought by
Federal National Mortgage Association
Purchase Details
Closed on
Jan 16, 1998
Sold by
Kleven Emery and Kleven Lisbeth
Bought by
Dodds Richard and Dodds Paula
Create a Home Valuation Report for This Property
The Home Valuation Report is an in-depth analysis detailing your home's value as well as a comparison with similar homes in the area
Home Values in the Area
Average Home Value in this Area
Purchase History
| Date | Buyer | Sale Price | Title Company |
|---|---|---|---|
| Chrisman Robert Jw | $239,000 | Lewis & Clerk T&E | |
| Harsma Jeffrey J | -- | -- | |
| Federal National Mortgage Association | -- | -- | |
| Dodds Richard | $120,000 | -- |
Source: Public Records
Mortgage History
| Date | Status | Borrower | Loan Amount |
|---|---|---|---|
| Open | Chrisman Robert Jw | $213,150 |
Source: Public Records
Tax History Compared to Growth
Tax History
| Year | Tax Paid | Tax Assessment Tax Assessment Total Assessment is a certain percentage of the fair market value that is determined by local assessors to be the total taxable value of land and additions on the property. | Land | Improvement |
|---|---|---|---|---|
| 2024 | $2,563 | $199,990 | $21,450 | $178,540 |
| 2023 | $3,471 | $195,495 | $20,625 | $174,870 |
| 2022 | $3,215 | $168,095 | $20,625 | $147,470 |
| 2021 | $3,021 | $152,430 | $20,625 | $131,805 |
| 2020 | $2,997 | $149,915 | $20,625 | $129,290 |
| 2019 | $3,024 | $150,820 | $20,625 | $130,195 |
| 2018 | $3,067 | $151,725 | $20,625 | $131,100 |
| 2017 | $2,787 | $138,160 | $20,625 | $117,535 |
| 2016 | $2,710 | $136,655 | $20,625 | $116,030 |
| 2014 | $2,456 | $119,265 | $13,500 | $105,765 |
Source: Public Records
Map
Nearby Homes
- 113 Parkview Dr
- 105 Parkview Dr
- 144 Oakmont Dr
- 140 Oakmont Dr
- 117 Parkview Dr
- 104 Parkview Dr
- 108 Parkview Dr
- 152 Oakmont Dr
- 136 Oakmont Dr Unit Drive
- 136 Oakmont Dr
- 112 Parkview Dr
- 121 Parkview Dr
- 116 Parkview Dr
- 108 Tamarack Ln
- 156 Oakmont Dr
- 156 Oakmont Dr
- 109 Tamarack Ln
- 143 Oakmont Dr
- 149 Oakmont Dr
- 120 Parkview Dr