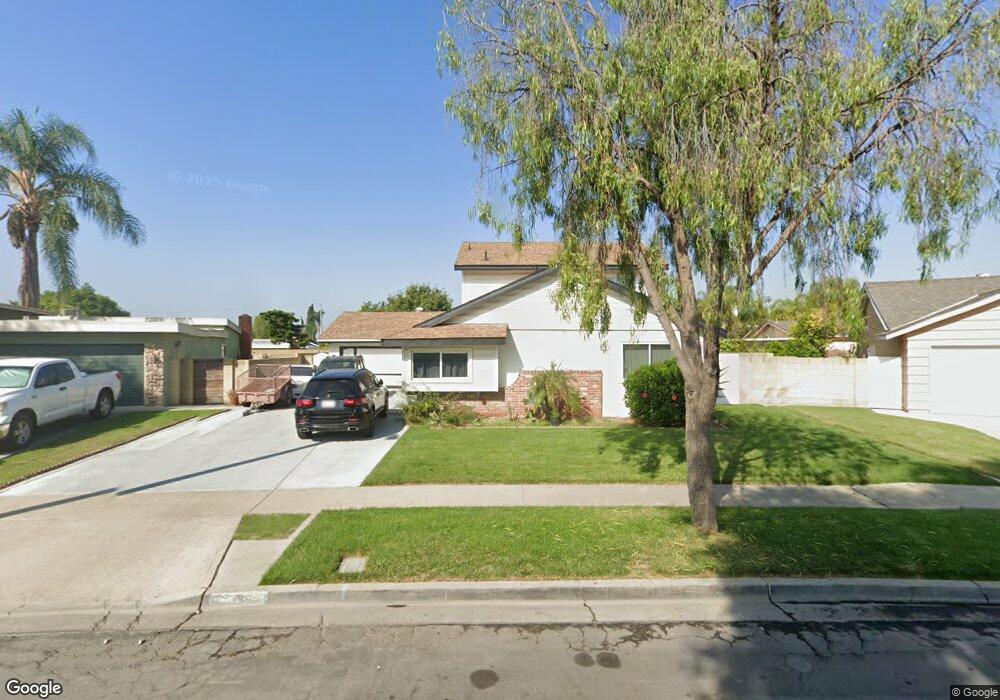
109 S Glendon St Anaheim, CA 92806
North Anaheim NeighborhoodEstimated Value: $1,070,000 - $1,255,000
3
Beds
2
Baths
2,106
Sq Ft
$534/Sq Ft
Est. Value
About This Home
This home is located at 109 S Glendon St, Anaheim, CA 92806 and is currently estimated at $1,124,437, approximately $533 per square foot. 109 S Glendon St is a home located in Orange County with nearby schools including Rio Vista Elementary School, Valadez Middle School Academy, and Valencia High School.
Ownership History
Date
Name
Owned For
Owner Type
Purchase Details
Closed on
Mar 29, 2021
Sold by
Salgado Jose
Bought by
Salgado Jose G and The Jose G Salgado Trust
Current Estimated Value
Purchase Details
Closed on
Aug 3, 2006
Sold by
Meisenheimer Gordon A and Joyce Meisenheimer A
Bought by
Salgado Jose
Home Financials for this Owner
Home Financials are based on the most recent Mortgage that was taken out on this home.
Original Mortgage
$500,000
Outstanding Balance
$302,469
Interest Rate
6.9%
Mortgage Type
Stand Alone First
Estimated Equity
$821,968
Create a Home Valuation Report for This Property
The Home Valuation Report is an in-depth analysis detailing your home's value as well as a comparison with similar homes in the area
Home Values in the Area
Average Home Value in this Area
Purchase History
| Date | Buyer | Sale Price | Title Company |
|---|---|---|---|
| Salgado Jose G | -- | None Available | |
| Salgado Jose | $625,000 | Landwood Title Company |
Source: Public Records
Mortgage History
| Date | Status | Borrower | Loan Amount |
|---|---|---|---|
| Open | Salgado Jose | $500,000 |
Source: Public Records
Tax History Compared to Growth
Tax History
| Year | Tax Paid | Tax Assessment Tax Assessment Total Assessment is a certain percentage of the fair market value that is determined by local assessors to be the total taxable value of land and additions on the property. | Land | Improvement |
|---|---|---|---|---|
| 2025 | $9,079 | $837,361 | $696,294 | $141,067 |
| 2024 | $9,079 | $820,943 | $682,642 | $138,301 |
| 2023 | $8,933 | $804,847 | $669,257 | $135,590 |
| 2022 | $8,544 | $758,880 | $649,331 | $109,549 |
| 2021 | $8,402 | $744,000 | $636,599 | $107,401 |
| 2020 | $7,578 | $658,920 | $551,519 | $107,401 |
| 2019 | $7,309 | $646,000 | $540,704 | $105,296 |
| 2018 | $7,358 | $646,000 | $540,704 | $105,296 |
| 2017 | $6,768 | $590,000 | $484,704 | $105,296 |
| 2016 | $6,758 | $590,000 | $484,704 | $105,296 |
| 2015 | $6,204 | $537,000 | $431,704 | $105,296 |
| 2014 | $5,411 | $470,000 | $364,704 | $105,296 |
Source: Public Records
Map
Nearby Homes
- 320 N Park Vista St Unit 105
- 320 N Park Vista St Unit 64
- 320 N Park Vista St
- 320 N Park Vista St Unit 109
- 320 N Park Vista St Unit 179
- 320 N Park Vista St Unit 180
- 320 N Park Vista St Unit 139
- 320 N Park Vista St Unit 115
- 320 N Park Vista St Unit 28
- 320 N Park Vista St Unit 58
- 238 S Trevor St
- 115 S Connie Cir
- 165 S Connie Cir
- 369 N Via Remo
- 438 N Via Capri
- 2842 E Virginia Ave
- 3052 N Spicewood St
- 337 W Mountain Holly Ave
- 356 W Mountain Holly Ave
- 3115 N Sunrise Ct
- 111 S Glendon St
- 107 S Glendon St
- 2922 E Robbins Ct
- 106 S Kingsley St
- 108 S Kingsley St
- 104 S Kingsley St
- 115 S Glendon St
- 112 S Glendon St
- 112 S Kingsley St
- 110 S Glendon St
- 102 S Kingsley St
- 2918 E Robbins Ct
- 119 S Glendon St
- 2929 E Belvedere Rd
- 118 S Kingsley St
- 100 N Kingsley St
- 105 S Glendon St
- 108 S Glendon St
- 2919 E Robbins Ct
- 2923 E Robbins Ct