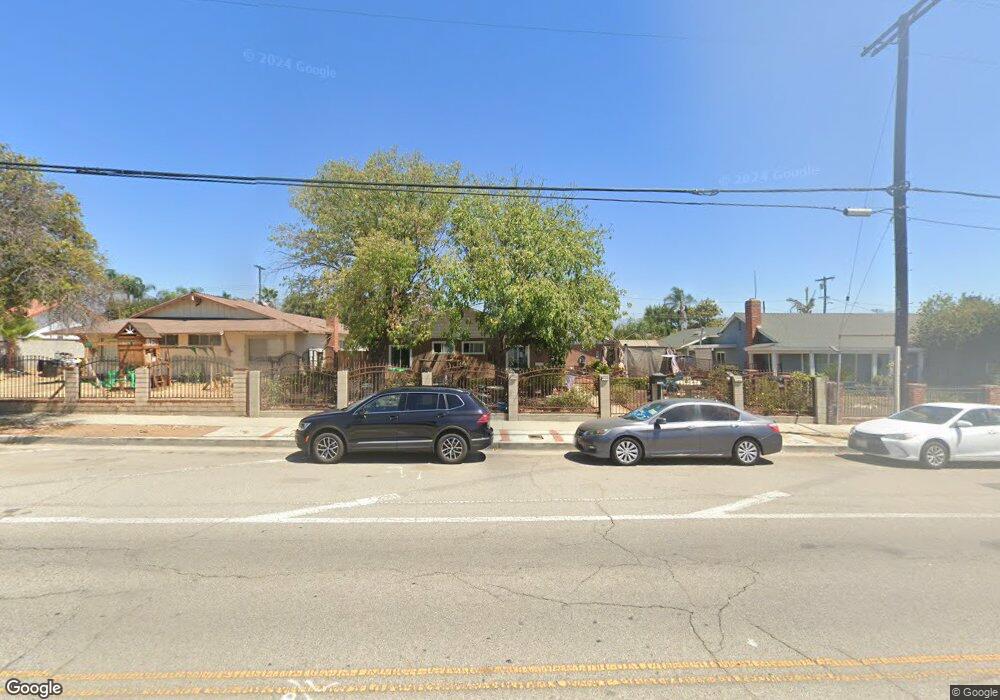
10900 Arleta Ave Mission Hills, CA 91345
Estimated Value: $783,641 - $969,000
4
Beds
2
Baths
1,303
Sq Ft
$658/Sq Ft
Est. Value
About This Home
This home is located at 10900 Arleta Ave, Mission Hills, CA 91345 and is currently estimated at $857,410, approximately $658 per square foot. 10900 Arleta Ave is a home located in Los Angeles County with nearby schools including O'Melveny Elementary School, San Fernando Middle School, and San Fernando Senior High School.
Ownership History
Date
Name
Owned For
Owner Type
Purchase Details
Closed on
May 16, 2013
Sold by
Gonzalez Jose Luis
Bought by
Gonzalez Jose Luis and Gonzalez Juana
Current Estimated Value
Home Financials for this Owner
Home Financials are based on the most recent Mortgage that was taken out on this home.
Original Mortgage
$287,819
Outstanding Balance
$207,483
Interest Rate
3.87%
Mortgage Type
FHA
Estimated Equity
$649,927
Purchase Details
Closed on
Feb 17, 2009
Sold by
Hayden Consuelo and The Susie Vasquez Living Trust
Bought by
Gonzalez Jose Luis
Home Financials for this Owner
Home Financials are based on the most recent Mortgage that was taken out on this home.
Original Mortgage
$304,385
Interest Rate
5.17%
Mortgage Type
FHA
Purchase Details
Closed on
Feb 12, 2008
Sold by
Vasquez Susie
Bought by
Vasquez Susie and Susie Vasquez Living Trust
Create a Home Valuation Report for This Property
The Home Valuation Report is an in-depth analysis detailing your home's value as well as a comparison with similar homes in the area
Home Values in the Area
Average Home Value in this Area
Purchase History
| Date | Buyer | Sale Price | Title Company |
|---|---|---|---|
| Gonzalez Jose Luis | -- | Arista National Title Co | |
| Gonzalez Jose Luis | $310,000 | Equity Title | |
| Vasquez Susie | -- | None Available |
Source: Public Records
Mortgage History
| Date | Status | Borrower | Loan Amount |
|---|---|---|---|
| Open | Gonzalez Jose Luis | $287,819 | |
| Previous Owner | Gonzalez Jose Luis | $304,385 |
Source: Public Records
Tax History Compared to Growth
Tax History
| Year | Tax Paid | Tax Assessment Tax Assessment Total Assessment is a certain percentage of the fair market value that is determined by local assessors to be the total taxable value of land and additions on the property. | Land | Improvement |
|---|---|---|---|---|
| 2025 | $5,085 | $399,185 | $249,944 | $149,241 |
| 2024 | $5,085 | $391,359 | $245,044 | $146,315 |
| 2023 | $4,992 | $383,687 | $240,240 | $143,447 |
| 2022 | $4,769 | $376,165 | $235,530 | $140,635 |
| 2021 | $4,709 | $368,790 | $230,912 | $137,878 |
| 2019 | $4,574 | $357,854 | $224,064 | $133,790 |
| 2018 | $4,445 | $350,838 | $219,671 | $131,167 |
| 2016 | $4,245 | $337,217 | $211,142 | $126,075 |
| 2015 | $4,185 | $332,153 | $207,971 | $124,182 |
| 2014 | $4,206 | $325,648 | $203,898 | $121,750 |
Source: Public Records
Map
Nearby Homes
- 14609 Fox St
- 10864 Wolcott Place
- 11068 Sharp Ave
- 14945 Chatsworth St
- 11023 Laurel Canyon Blvd
- 14658 Maclay St
- 10943 Laurel Canyon Blvd Unit 10
- 10943 Laurel Canyon Blvd
- 14655 Maclay St
- 10980 Burnet Ave
- 11225 Acala Ave
- 10901 Laurel Canyon Blvd Unit 301
- 10901 Laurel Canyon Blvd Unit 101
- 10901 Laurel Canyon Blvd Unit 108
- 10901 Laurel Canyon Blvd Unit 201
- 10901 Laurel Canyon Blvd
- 14742 San Jose St
- 10918 Laurel Canyon Blvd
- 14763 San Fernando Mission Blvd
- 15013 San Jose St
- 10906 Arleta Ave
- 10882 Arleta Ave
- 10876 Arleta Ave
- 10955 Bartee Ave
- 10914 Arleta Ave
- 10953 Bartee Ave
- 10959 Bartee Ave
- 10870 Arleta Ave
- 10901 Arleta Ave
- 10965 Bartee Ave
- 10883 Arleta Ave
- 10907 Arleta Ave
- 10877 Arleta Ave
- 10913 Arleta Ave
- 10971 Bartee Ave
- 14631 Fox St
- 10949 Bartee Ave
- 14617 Fox St
- 14651 Fox St
- 10979 Bartee Ave