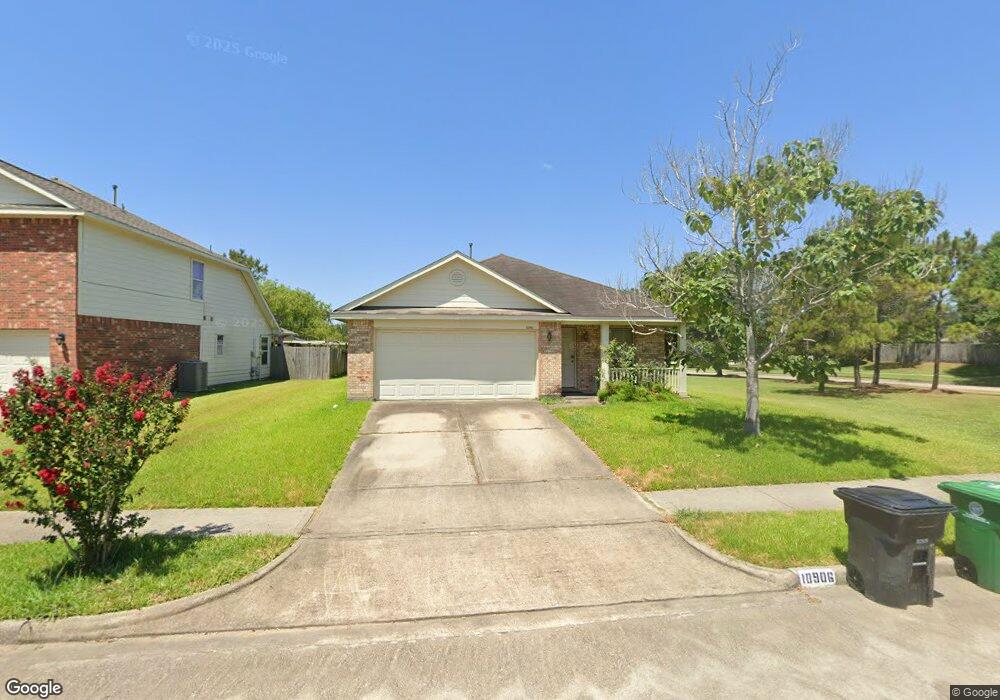
10906 Great Hawk Ln Houston, TX 77075
Southbelt-Ellington NeighborhoodEstimated Value: $254,201 - $294,000
3
Beds
2
Baths
1,509
Sq Ft
$177/Sq Ft
Est. Value
About This Home
This home is located at 10906 Great Hawk Ln, Houston, TX 77075 and is currently estimated at $267,300, approximately $177 per square foot. 10906 Great Hawk Ln is a home located in Harris County with nearby schools including Laura Welch Bush Elementary School, Morris Middle School, and Beverly Hill Intermediate School.
Ownership History
Date
Name
Owned For
Owner Type
Purchase Details
Closed on
Oct 31, 2008
Sold by
Secretary Of Housing & Urban Development
Bought by
Taparauskas Anne Maria
Current Estimated Value
Home Financials for this Owner
Home Financials are based on the most recent Mortgage that was taken out on this home.
Original Mortgage
$109,832
Outstanding Balance
$71,200
Interest Rate
5.83%
Mortgage Type
Purchase Money Mortgage
Estimated Equity
$196,100
Purchase Details
Closed on
Nov 6, 2007
Sold by
Everhome Mortgage Co
Bought by
Hud
Purchase Details
Closed on
Jul 26, 2005
Sold by
Beazer Homes Texas Lp
Bought by
Lewis Sheila
Home Financials for this Owner
Home Financials are based on the most recent Mortgage that was taken out on this home.
Original Mortgage
$127,292
Interest Rate
5.61%
Mortgage Type
FHA
Create a Home Valuation Report for This Property
The Home Valuation Report is an in-depth analysis detailing your home's value as well as a comparison with similar homes in the area
Home Values in the Area
Average Home Value in this Area
Purchase History
| Date | Buyer | Sale Price | Title Company |
|---|---|---|---|
| Taparauskas Anne Maria | -- | None Available | |
| Hud | -- | None Available | |
| Everhome Mortgage Co | $138,922 | None Available | |
| Lewis Sheila | -- | Texas Lone Star Title Lp |
Source: Public Records
Mortgage History
| Date | Status | Borrower | Loan Amount |
|---|---|---|---|
| Open | Taparauskas Anne Maria | $109,832 | |
| Previous Owner | Lewis Sheila | $127,292 |
Source: Public Records
Tax History Compared to Growth
Tax History
| Year | Tax Paid | Tax Assessment Tax Assessment Total Assessment is a certain percentage of the fair market value that is determined by local assessors to be the total taxable value of land and additions on the property. | Land | Improvement |
|---|---|---|---|---|
| 2025 | $1,597 | $251,130 | $45,581 | $205,549 |
| 2024 | $1,597 | $251,130 | $45,581 | $205,549 |
| 2023 | $1,597 | $247,178 | $45,581 | $201,597 |
| 2022 | $6,381 | $229,854 | $45,581 | $184,273 |
| 2021 | $6,118 | $190,824 | $40,219 | $150,605 |
| 2020 | $5,950 | $178,733 | $40,219 | $138,514 |
| 2019 | $5,671 | $173,592 | $34,856 | $138,736 |
| 2018 | $1,696 | $151,905 | $32,175 | $119,730 |
| 2017 | $4,528 | $151,905 | $32,175 | $119,730 |
| 2016 | $4,116 | $144,069 | $26,813 | $117,256 |
| 2015 | $2,959 | $134,345 | $26,813 | $107,532 |
| 2014 | $2,959 | $110,086 | $26,813 | $83,273 |
Source: Public Records
Map
Nearby Homes
- 8718 Black Cliff Ln
- 8615 Tartan Walk Ln
- 11115 Opal Glen Ln
- 10806 Tallow Briar
- 9130 Garden Breeze Dr
- 10858 Shannon Mills Ln
- 001 Fuqua St
- 8612 Fuqua St
- 8420 Fuqua St
- 9307 Fuqua Ridge Ln
- 10934 Bradford Way Dr
- 10918 Linden Gate Dr
- 10506 Pleasant Villas Ln
- 0 Fuqua St Unit 64883593
- 0 Fuqua St Unit 45902141
- 0 Fuqua St Unit 97219329
- 10827 Linden Gate Dr
- 7329 Madison Commons Ln
- 7322 Madison Commons Ln
- 11019 Cayman Mist Dr
- 10910 Great Hawk Ln
- 8903 Smokey Ridge Ln
- 10918 Great Hawk Ln
- 8907 Smokey Ridge Ln
- 10915 Great Hawk Ln
- 8802 Durham Manor Ln
- 8810 Durham Manor Ln
- 10922 Great Hawk Ln
- 10919 Great Hawk Ln
- 8814 Durham Manor Ln
- 8806 Durham Manor Ln
- 8911 Smokey Ridge Ln
- 8818 Durham Manor Ln
- 10923 Great Hawk Ln
- 10926 Great Hawk Ln
- 10870 Heathercliff Ln
- 8822 Durham Manor Ln
- 8915 Smokey Ridge Ln
- 10927 Great Hawk Ln
- 10910 Mossy Hollow Ln