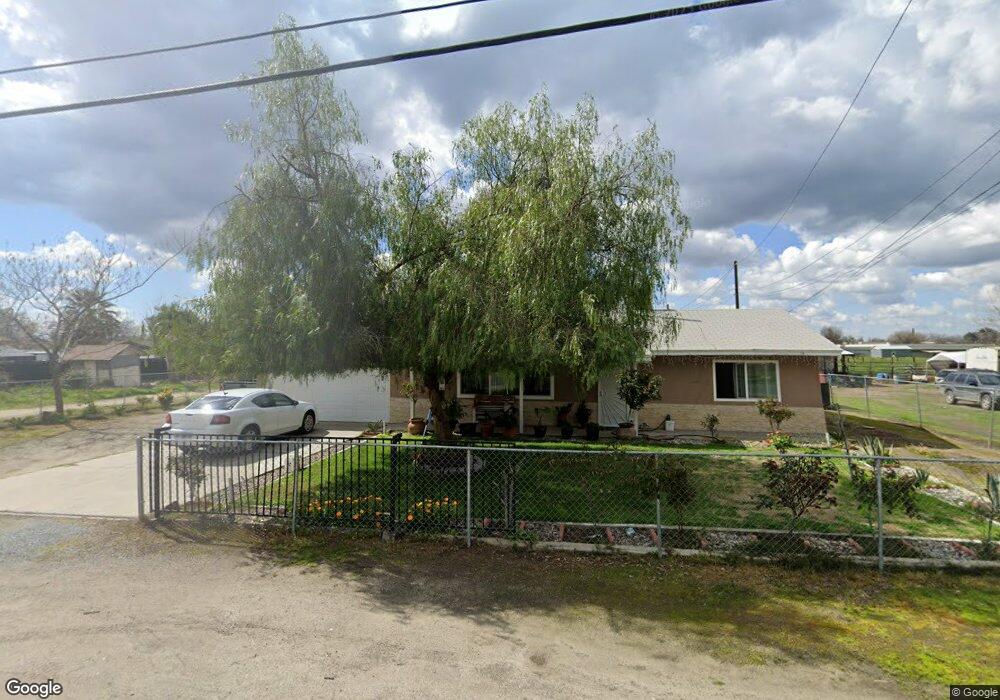
1091 N Howland St Porterville, CA 93257
Porterville Northwest NeighborhoodEstimated Value: $290,000 - $405,000
2
Beds
1
Bath
1,040
Sq Ft
$308/Sq Ft
Est. Value
About This Home
This home is located at 1091 N Howland St, Porterville, CA 93257 and is currently estimated at $319,947, approximately $307 per square foot. 1091 N Howland St is a home located in Tulare County with nearby schools including Monte Vista Elementary School, Strathmore Elementary School, and Sequoia Middle School.
Ownership History
Date
Name
Owned For
Owner Type
Purchase Details
Closed on
Sep 2, 2016
Sold by
Pina Deborah J
Bought by
Rodriguez Esparza Jose and Moreno Nancy Contreras
Current Estimated Value
Home Financials for this Owner
Home Financials are based on the most recent Mortgage that was taken out on this home.
Original Mortgage
$117,900
Outstanding Balance
$94,174
Interest Rate
3.43%
Mortgage Type
New Conventional
Estimated Equity
$225,773
Purchase Details
Closed on
Dec 22, 2004
Sold by
Ulloa Deborah J
Bought by
Pina Deborah J and Ulloa Deborah J
Purchase Details
Closed on
Dec 1, 1995
Sold by
Miller Deloris
Bought by
Ulloa Deborah J
Home Financials for this Owner
Home Financials are based on the most recent Mortgage that was taken out on this home.
Original Mortgage
$62,934
Interest Rate
7.36%
Mortgage Type
FHA
Create a Home Valuation Report for This Property
The Home Valuation Report is an in-depth analysis detailing your home's value as well as a comparison with similar homes in the area
Home Values in the Area
Average Home Value in this Area
Purchase History
| Date | Buyer | Sale Price | Title Company |
|---|---|---|---|
| Rodriguez Esparza Jose | $131,000 | Chicago Title Company | |
| Pina Deborah J | -- | -- | |
| Ulloa Deborah J | $63,000 | First American Title Ins Co |
Source: Public Records
Mortgage History
| Date | Status | Borrower | Loan Amount |
|---|---|---|---|
| Open | Rodriguez Esparza Jose | $117,900 | |
| Previous Owner | Ulloa Deborah J | $62,934 |
Source: Public Records
Tax History Compared to Growth
Tax History
| Year | Tax Paid | Tax Assessment Tax Assessment Total Assessment is a certain percentage of the fair market value that is determined by local assessors to be the total taxable value of land and additions on the property. | Land | Improvement |
|---|---|---|---|---|
| 2025 | $1,615 | $152,033 | $40,619 | $111,414 |
| 2024 | $1,615 | $149,053 | $39,823 | $109,230 |
| 2023 | $1,613 | $146,132 | $39,043 | $107,089 |
| 2022 | $1,563 | $143,268 | $38,278 | $104,990 |
| 2021 | $1,545 | $140,458 | $37,527 | $102,931 |
| 2020 | $1,529 | $139,018 | $37,142 | $101,876 |
| 2019 | $1,501 | $136,292 | $36,414 | $99,878 |
| 2018 | $1,474 | $133,620 | $35,700 | $97,920 |
| 2017 | $1,438 | $131,000 | $35,000 | $96,000 |
| 2016 | $875 | $88,411 | $28,068 | $60,343 |
| 2015 | $861 | $87,083 | $27,646 | $59,437 |
| 2014 | $839 | $85,377 | $27,104 | $58,273 |
Source: Public Records
Map
Nearby Homes
- 680 W Gerry Cir
- 1167 N Main St
- 681 W Mulberry Ave
- 927 Shadowood Place
- 701 W Theta Ave
- 701 Theta Ave
- 1495 N Highland Dr
- 0 N Marshall St
- 793 Pioneer Ave
- 829 Pioneer Ave
- 0 N Scenic Dr Unit 237652
- 1070 N Highland Dr
- 1485 N Highland Dr
- 1105 N Scenic Dr
- 572 Memory Ln
- 579 N Villa St
- 479 W Grand Ave
- 91 Heatherwood Ct
- 816 W Grand Ave
- 824 W Grand Ave
- 1081 N Howland St
- 1081 N Howland St
- 1067 N Howland St
- 1084 N Howland St
- 1113 N Howland St
- 1106 N Howland St
- 1075 N Howland St
- 1126 N Howland St
- 1059 N Howland St
- 1058 N Howland St
- 1127 N Howland St
- 1135 N Howland St
- 1045 N Howland St
- 1055 N Howland St
- 1134 N Howland St
- 1139 N Howland St
- 1143 N Howland St
- 1048 N Howland St
- 1039 N Howland St
- 1072 N Howland St