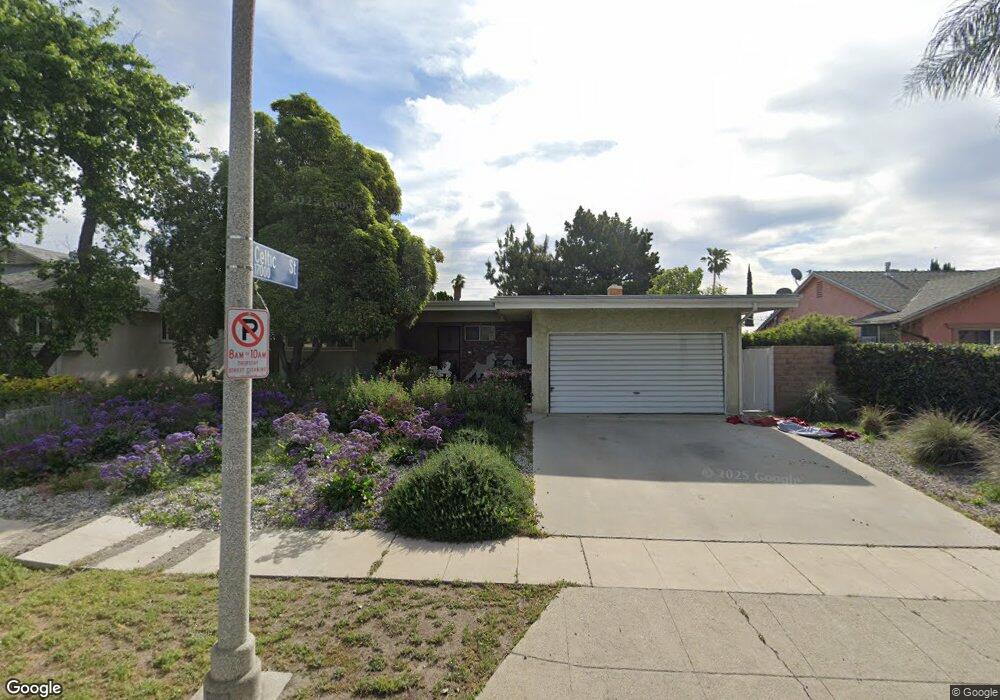
10920 Paso Robles Ave Granada Hills, CA 91344
Estimated Value: $825,889 - $952,000
3
Beds
2
Baths
1,193
Sq Ft
$743/Sq Ft
Est. Value
About This Home
This home is located at 10920 Paso Robles Ave, Granada Hills, CA 91344 and is currently estimated at $886,472, approximately $743 per square foot. 10920 Paso Robles Ave is a home located in Los Angeles County with nearby schools including Granada Elementary School for Advanced Studies, Patrick Henry Middle School, and Valley Academy of Arts & Sciences.
Ownership History
Date
Name
Owned For
Owner Type
Purchase Details
Closed on
Apr 7, 2017
Sold by
Dover Diana L
Bought by
Dover Diana L and Diana L Dover Trust
Current Estimated Value
Purchase Details
Closed on
Jul 2, 2012
Sold by
Dover Diana L and Bendavid Michael
Bought by
Dover Diana L
Home Financials for this Owner
Home Financials are based on the most recent Mortgage that was taken out on this home.
Original Mortgage
$133,874
Outstanding Balance
$91,929
Interest Rate
3.56%
Mortgage Type
New Conventional
Estimated Equity
$794,543
Purchase Details
Closed on
Apr 13, 1994
Sold by
Summers John P and Summers Mary K
Bought by
Dover Diane L
Home Financials for this Owner
Home Financials are based on the most recent Mortgage that was taken out on this home.
Original Mortgage
$103,500
Interest Rate
8.53%
Create a Home Valuation Report for This Property
The Home Valuation Report is an in-depth analysis detailing your home's value as well as a comparison with similar homes in the area
Home Values in the Area
Average Home Value in this Area
Purchase History
| Date | Buyer | Sale Price | Title Company |
|---|---|---|---|
| Dover Diana L | -- | None Available | |
| Dover Diana L | -- | Chicago Title Company | |
| Dover Diane L | $137,727 | -- |
Source: Public Records
Mortgage History
| Date | Status | Borrower | Loan Amount |
|---|---|---|---|
| Open | Dover Diana L | $133,874 | |
| Previous Owner | Dover Diane L | $103,500 |
Source: Public Records
Tax History Compared to Growth
Tax History
| Year | Tax Paid | Tax Assessment Tax Assessment Total Assessment is a certain percentage of the fair market value that is determined by local assessors to be the total taxable value of land and additions on the property. | Land | Improvement |
|---|---|---|---|---|
| 2025 | $3,005 | $234,524 | $121,513 | $113,011 |
| 2024 | $3,005 | $229,927 | $119,131 | $110,796 |
| 2023 | $2,950 | $225,420 | $116,796 | $108,624 |
| 2022 | $2,819 | $221,001 | $114,506 | $106,495 |
| 2021 | $2,780 | $216,668 | $112,261 | $104,407 |
| 2019 | $2,700 | $210,243 | $108,932 | $101,311 |
| 2018 | $2,606 | $206,122 | $106,797 | $99,325 |
| 2016 | $2,481 | $198,119 | $102,650 | $95,469 |
| 2015 | $2,446 | $195,144 | $101,109 | $94,035 |
| 2014 | $2,461 | $191,322 | $99,129 | $92,193 |
Source: Public Records
Map
Nearby Homes
- 17043 Celtic St
- 17068 Celtic St
- 16870 Tulsa St
- 17062 San Fernando Mission Blvd
- 16857 Chatsworth St
- 16940 Chatsworth St Unit 208
- 16857 San Fernando Mission Blvd Unit 24
- 16857 San Fernando Mission Blvd Unit 44
- 17175 Chatsworth St
- 17257 Horace St
- 16712 Tribune St
- 17230 Chatsworth St Unit 1
- 17317 Los Alimos St
- 10752 Gerald Ave
- 10501 Forbes Ave
- 17222 Kingsbury St
- 16609 Chatsworth St
- 10452 Balboa Blvd
- 10530 Rubio Ave
- 17014 Rinaldi St
- 10926 Paso Robles Ave
- 10914 Paso Robles Ave
- 10932 Paso Robles Ave
- 10908 Paso Robles Ave
- 10919 Balboa Blvd
- 17030 Celtic St
- 10915 Balboa Blvd
- 10929 Balboa Blvd
- 10938 Paso Robles Ave
- 10900 Paso Robles Ave
- 17031 Celtic St
- 17036 Celtic St
- 17031 Tulsa St
- 10901 Balboa Blvd
- 17009 Tulsa St
- 17037 Celtic St
- 10946 Paso Robles Ave
- 10943 Balboa Blvd
- 17039 Tulsa St
- 17042 Celtic St