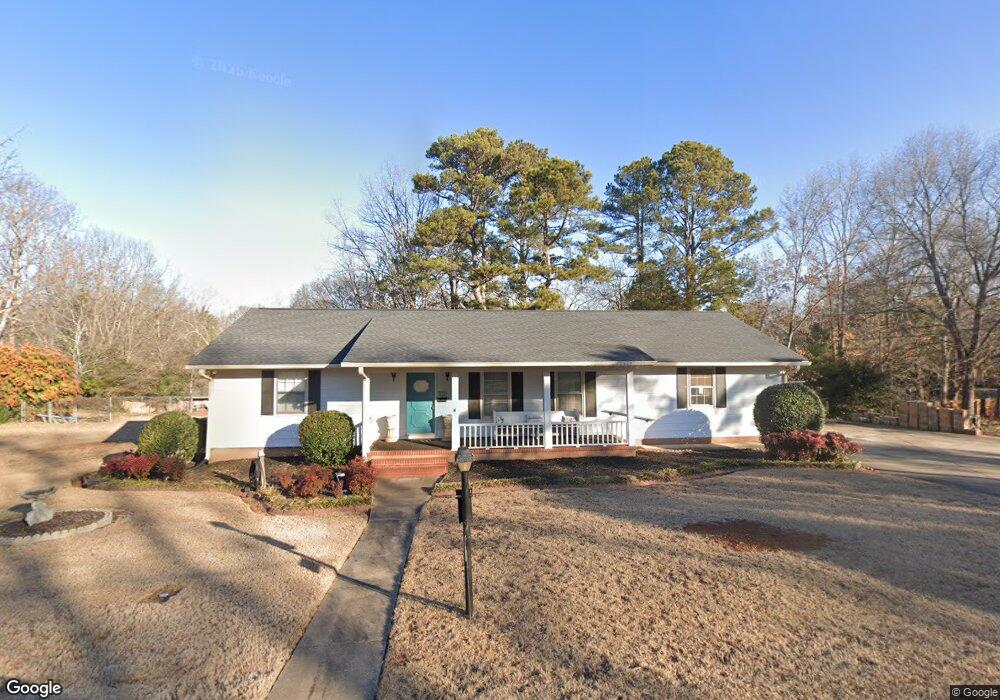
11 Bunny Hop Trail Watkinsville, GA 30677
Estimated Value: $341,000 - $396,000
--
Bed
--
Bath
1,598
Sq Ft
$227/Sq Ft
Est. Value
About This Home
This home is located at 11 Bunny Hop Trail, Watkinsville, GA 30677 and is currently estimated at $362,191, approximately $226 per square foot. 11 Bunny Hop Trail is a home located in Oconee County with nearby schools including Oconee County Elementary School, Oconee County Primary School, and Oconee County Middle School.
Ownership History
Date
Name
Owned For
Owner Type
Purchase Details
Closed on
Oct 19, 2023
Sold by
Lafontaine Christina G
Bought by
Starlake Investments Llc
Current Estimated Value
Purchase Details
Closed on
Apr 22, 2022
Sold by
Gonzales Jeanne C
Bought by
Lafontaine Christina G and Lafontaine David Wade
Home Financials for this Owner
Home Financials are based on the most recent Mortgage that was taken out on this home.
Original Mortgage
$191,250
Interest Rate
4.16%
Mortgage Type
New Conventional
Purchase Details
Closed on
Dec 10, 2021
Sold by
Vaughn Marcia T
Bought by
Gonzales Jeanne C
Home Financials for this Owner
Home Financials are based on the most recent Mortgage that was taken out on this home.
Original Mortgage
$90,000
Interest Rate
2.98%
Mortgage Type
New Conventional
Purchase Details
Closed on
Jun 30, 2021
Sold by
Thornton Doris P
Bought by
Vaughn Marcia T and Thornton Irrev Tr
Purchase Details
Closed on
Dec 28, 2020
Sold by
Thornton Lambert Gene
Bought by
Thornton Doris P
Create a Home Valuation Report for This Property
The Home Valuation Report is an in-depth analysis detailing your home's value as well as a comparison with similar homes in the area
Home Values in the Area
Average Home Value in this Area
Purchase History
| Date | Buyer | Sale Price | Title Company |
|---|---|---|---|
| Starlake Investments Llc | -- | -- | |
| Lafontaine Christina Trust | -- | -- | |
| Lafontaine Christina G | $255,000 | -- | |
| Gonzales Jeanne C | $255,000 | -- | |
| Vaughn Marcia T | -- | -- | |
| Thornton Doris P | -- | -- |
Source: Public Records
Mortgage History
| Date | Status | Borrower | Loan Amount |
|---|---|---|---|
| Previous Owner | Lafontaine Christina G | $191,250 | |
| Previous Owner | Gonzales Jeanne C | $90,000 |
Source: Public Records
Tax History Compared to Growth
Tax History
| Year | Tax Paid | Tax Assessment Tax Assessment Total Assessment is a certain percentage of the fair market value that is determined by local assessors to be the total taxable value of land and additions on the property. | Land | Improvement |
|---|---|---|---|---|
| 2024 | $2,940 | $129,084 | $20,000 | $109,084 |
| 2023 | $2,889 | $123,380 | $20,000 | $103,380 |
| 2022 | $2,443 | $105,368 | $20,000 | $85,368 |
| 2021 | $1,536 | $72,512 | $14,400 | $58,112 |
| 2020 | $1,203 | $59,074 | $14,400 | $44,674 |
| 2019 | $1,168 | $57,444 | $14,400 | $43,044 |
| 2018 | $1,038 | $51,831 | $14,400 | $37,431 |
| 2017 | $941 | $47,944 | $14,400 | $33,544 |
| 2016 | $899 | $46,211 | $13,200 | $33,011 |
| 2015 | $881 | $45,474 | $13,200 | $32,274 |
| 2014 | $863 | $44,165 | $13,200 | $30,965 |
| 2013 | -- | $42,843 | $13,200 | $29,643 |
Source: Public Records
Map
Nearby Homes
- 170 Elliot Cir
- 86 Cedar Dr
- 88 Cedar Dr
- 2051 Simonton Bridge Rd
- 1010 Jeremy Dr
- 1320 Katie Ln
- 1001 Moreland Dr
- 1051 Simonton Way
- 96 Morrison St Unit 53
- 92 Morrison St Unit 54
- 90 Morrison St Unit 55
- 96 Morrison St
- 90 Morrison St
- 1240 Summit Dr
- 1040 Thomas Ave
- 1050 Summit Oaks Dr
- 1036 Falling Leaf Ct Unit 2
- 1036 Falling Leaf Ct
- 70, 72 Colham Ferry Extension
- 2885 Electric Ave
- 16 White St
- 10 White Ln
- 17 Bunny Hop Trail
- 12 Bunny Hop Trail
- 64 White St
- 3 Bunny Hop Trail
- 4 Bunny Hop Trail
- 11 White Ln
- 65 White St
- 76 White St
- 86 White St
- 3 White Ln
- 0 White St Unit CM954393
- 0 White St Unit 8151696
- 0 White St
- 0 White St Unit 957788
- 0 White St Unit 3122959
- 0 White St Unit 7045164
- 0 White St Unit 7602534
- 0 White St Unit 8474624