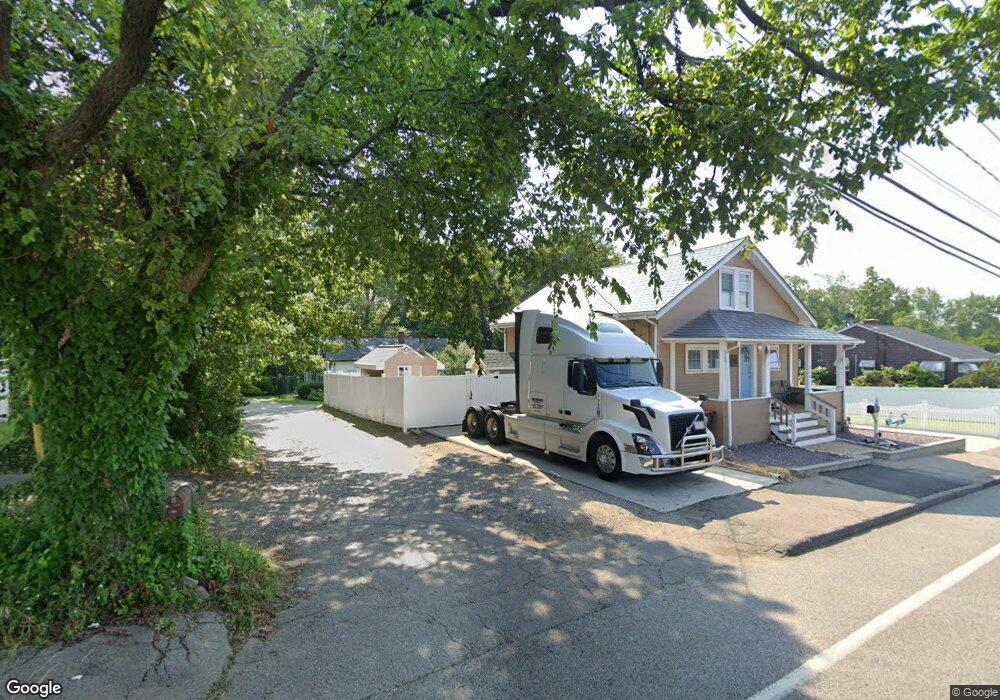
11 Cranston St Brockton, MA 02302
Estimated Value: $343,000 - $429,000
2
Beds
1
Bath
936
Sq Ft
$421/Sq Ft
Est. Value
About This Home
This home is located at 11 Cranston St, Brockton, MA 02302 and is currently estimated at $394,106, approximately $421 per square foot. 11 Cranston St is a home located in Plymouth County with nearby schools including Brookfield Elementary School, Mary E. Baker Elementary School, and Downey Elementary School.
Ownership History
Date
Name
Owned For
Owner Type
Purchase Details
Closed on
Feb 15, 1995
Sold by
Department Of Housing & Urban Dev
Bought by
Spear Elizabeth K
Current Estimated Value
Home Financials for this Owner
Home Financials are based on the most recent Mortgage that was taken out on this home.
Original Mortgage
$49,028
Interest Rate
9.19%
Mortgage Type
Purchase Money Mortgage
Purchase Details
Closed on
May 16, 1994
Sold by
Vajgrt Brian and Vajgrt Raylene
Bought by
Country Wide Funding
Purchase Details
Closed on
Oct 18, 1990
Sold by
Perrault Arthur N
Bought by
Vajgrt Brian
Home Financials for this Owner
Home Financials are based on the most recent Mortgage that was taken out on this home.
Original Mortgage
$100,550
Interest Rate
10.14%
Mortgage Type
Purchase Money Mortgage
Create a Home Valuation Report for This Property
The Home Valuation Report is an in-depth analysis detailing your home's value as well as a comparison with similar homes in the area
Home Values in the Area
Average Home Value in this Area
Purchase History
| Date | Buyer | Sale Price | Title Company |
|---|---|---|---|
| Spear Elizabeth K | $49,999 | -- | |
| Country Wide Funding | $112,937 | -- | |
| Vajgrt Brian | $101,500 | -- |
Source: Public Records
Mortgage History
| Date | Status | Borrower | Loan Amount |
|---|---|---|---|
| Closed | Vajgrt Brian | $49,028 | |
| Previous Owner | Vajgrt Brian | $100,550 |
Source: Public Records
Tax History Compared to Growth
Tax History
| Year | Tax Paid | Tax Assessment Tax Assessment Total Assessment is a certain percentage of the fair market value that is determined by local assessors to be the total taxable value of land and additions on the property. | Land | Improvement |
|---|---|---|---|---|
| 2025 | $4,301 | $355,200 | $143,100 | $212,100 |
| 2024 | $4,178 | $347,600 | $143,100 | $204,500 |
| 2023 | $3,934 | $303,100 | $107,500 | $195,600 |
| 2022 | $3,941 | $282,100 | $97,500 | $184,600 |
| 2021 | $3,448 | $237,800 | $87,800 | $150,000 |
| 2020 | $3,509 | $231,600 | $84,500 | $147,100 |
| 2019 | $3,444 | $221,600 | $77,000 | $144,600 |
| 2018 | $3,079 | $191,700 | $77,000 | $114,700 |
| 2017 | $2,808 | $174,400 | $77,000 | $97,400 |
| 2016 | $2,298 | $132,400 | $73,400 | $59,000 |
| 2015 | $2,044 | $112,600 | $73,400 | $39,200 |
| 2014 | $2,215 | $122,200 | $73,400 | $48,800 |
Source: Public Records
Map
Nearby Homes
- 11 Cranston St Unit 11
- 210 Quincy St
- 216 Quincy St
- 204 Quincy St
- 224 Quincy St
- 205 Quincy St
- 201 Quincy St
- 211 Quincy St
- 209 Quincy St Unit 209
- 228 Quincy St
- 200 Quincy St
- 232 Quincy St
- 225 Quincy Ave
- 231 Quincy St
- 233 Quincy St
- 234 Quincy St
- 194 Quincy St
- 179 Quincy St
- 179 Quincy St Unit C
- 61 Libby St