Estimated Value: $266,575 - $383,000
--
Bed
--
Bath
1,508
Sq Ft
$218/Sq Ft
Est. Value
About This Home
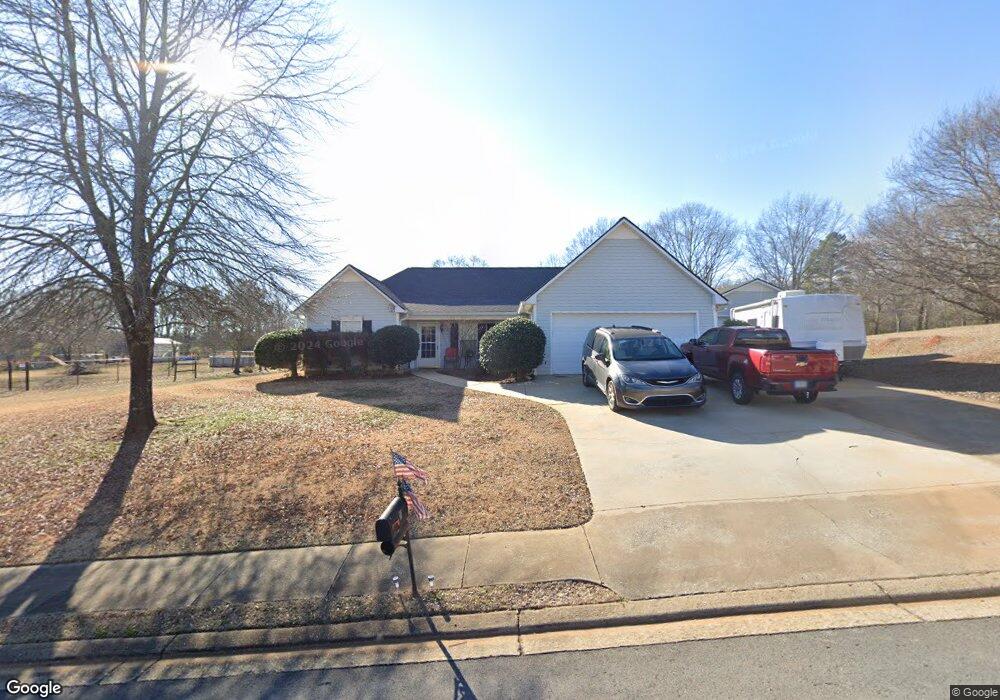
This home is located at 11 Ferry Crossing Dr SE, Rome, GA 30161 and is currently estimated at $328,144, approximately $217 per square foot. 11 Ferry Crossing Dr SE is a home located in Floyd County with nearby schools including Model Middle School and Model High School.
Ownership History
Date
Name
Owned For
Owner Type
Purchase Details
Closed on
Sep 12, 2005
Sold by
Naguszewski Glendene K
Bought by
Brock Steven Glenn and Brock Cathy Joan
Current Estimated Value
Home Financials for this Owner
Home Financials are based on the most recent Mortgage that was taken out on this home.
Original Mortgage
$132,720
Outstanding Balance
$71,050
Interest Rate
5.86%
Mortgage Type
New Conventional
Estimated Equity
$257,094
Purchase Details
Closed on
May 19, 2005
Sold by
Naguszewski William K
Bought by
Naguszewski Glendene K
Purchase Details
Closed on
Jan 29, 2003
Sold by
Hackett Tom Builder & Developer Inc
Bought by
Naguszewski William K and Naguszewski Glendene K
Purchase Details
Closed on
Feb 28, 2002
Sold by
Ferry Crossing Development Inc
Bought by
Hackett Tom Builder & Developer Inc
Purchase Details
Closed on
Jul 18, 2001
Bought by
Ferry Crossing Development Inc
Create a Home Valuation Report for This Property
The Home Valuation Report is an in-depth analysis detailing your home's value as well as a comparison with similar homes in the area
Home Values in the Area
Average Home Value in this Area
Purchase History
| Date | Buyer | Sale Price | Title Company |
|---|---|---|---|
| Brock Steven Glenn | $165,900 | -- | |
| Naguszewski Glendene K | -- | -- | |
| Naguszewski William K | $125,900 | -- | |
| Hackett Tom Builder & Developer Inc | $25,200 | -- | |
| Ferry Crossing Development Inc | -- | -- |
Source: Public Records
Mortgage History
| Date | Status | Borrower | Loan Amount |
|---|---|---|---|
| Open | Brock Steven Glenn | $132,720 | |
| Closed | Brock Steven Glenn | $24,800 |
Source: Public Records
Tax History Compared to Growth
Tax History
| Year | Tax Paid | Tax Assessment Tax Assessment Total Assessment is a certain percentage of the fair market value that is determined by local assessors to be the total taxable value of land and additions on the property. | Land | Improvement |
|---|---|---|---|---|
| 2024 | $2,026 | $115,027 | $14,700 | $100,327 |
| 2023 | $1,777 | $100,000 | $14,700 | $85,300 |
| 2022 | $1,419 | $76,733 | $14,000 | $62,733 |
| 2021 | $1,345 | $71,490 | $14,000 | $57,490 |
| 2020 | $1,303 | $68,694 | $14,000 | $54,694 |
| 2019 | $1,231 | $66,294 | $14,000 | $52,294 |
| 2018 | $1,713 | $57,789 | $14,000 | $43,789 |
| 2017 | $1,857 | $62,435 | $14,000 | $48,435 |
| 2016 | $1,857 | $61,704 | $14,000 | $47,704 |
| 2015 | $1,628 | $59,584 | $14,000 | $45,584 |
| 2014 | $1,628 | $55,238 | $14,000 | $41,238 |
Source: Public Records
Map
Nearby Homes
- 3 Outpost Trail SE
- 13 Broken Arrow Trail SE
- 1 Outpost Trail SE
- 16 Fallen Branch Cir SE
- 0 Fallen Branch Cir SE Unit 10311756
- 0 Fallen Branch Cir SE Unit 10172755
- 0 Fallen Branch Cir SE Unit 7234792
- 0 N Quarters Dr Unit 37 10390869
- 0 N Quarters Dr Unit 7467468
- 30 Fallen Branch Cir SE
- 9 Everwood Ct SE
- 11 Everwood Ct SE
- 25 Everwood Ct SE
- 21 Everwood Ct SE
- 550 Freeman Ferry Rd SE
- 139 Shoals Ferry Rd SE
- 45 Wildflower Rd NE
- 8 Trimble Way SE
- 0 Mountain Creek Dr SE Unit 10436191
- 7 Trimble Way SE
- 9 Ferry Crossing Dr SE
- 13 Ferry Crossing Dr SE
- 13 Ferry Crossing Dr SE Unit 1
- 0 Ferry Crossing Dr SE Unit 3110069
- 15 Ferry Crossing Dr SE
- 12 Ferry Crossing Dr SE
- 7 Ferry Crossing Dr SE
- 8 Ferry Crossing Dr SE
- 14 Ferry Crossing Dr SE
- 17 Ferry Crossing Dr SE
- 5 Ferry Crossing Dr SE
- 6 Ferry Crossing Dr SE
- 0 Wagnon Ct SE Unit 7066724
- 7 Wagnon Ct SE
- 9 Wagnon Ct SE
- 19 Ferry Crossing Dr SE
- 20 Ferry Crossing Dr SE
- 11 Wagnon Ct SE
- 3 Ferry Crossing Dr SE
- 13 Wagnon Ct SE