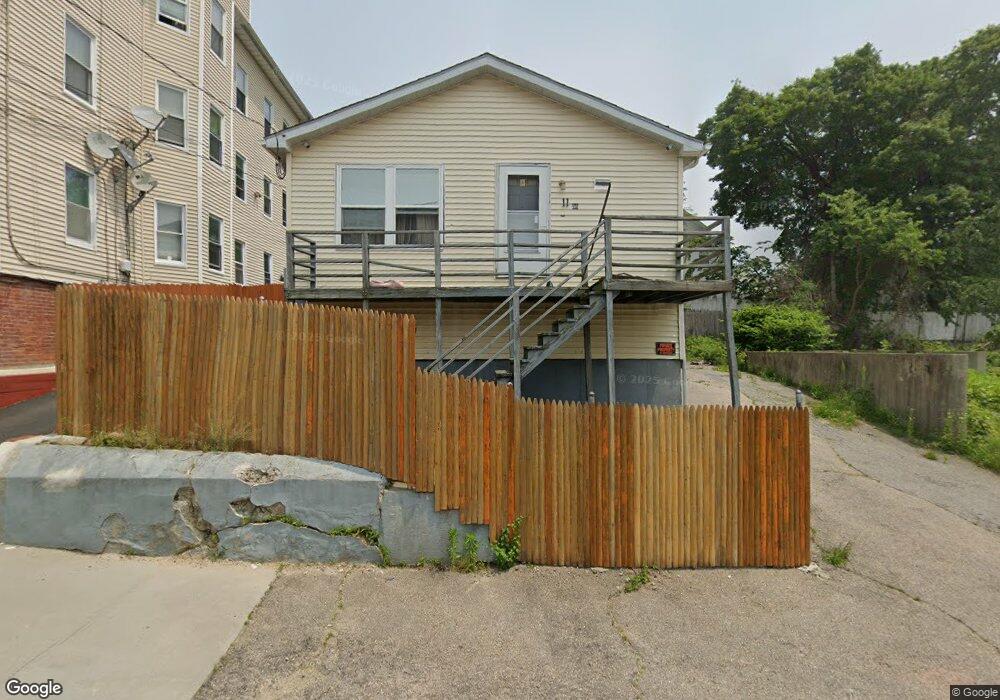
11 Greenwood St Providence, RI 02909
Olneyville NeighborhoodEstimated Value: $330,000 - $382,000
3
Beds
2
Baths
1,856
Sq Ft
$193/Sq Ft
Est. Value
About This Home
This home is located at 11 Greenwood St, Providence, RI 02909 and is currently estimated at $358,477, approximately $193 per square foot. 11 Greenwood St is a home located in Providence County with nearby schools including Asa Messer Elementary School, Charles N. Fortes Elementary School, and Laurel Hill Annex School.
Ownership History
Date
Name
Owned For
Owner Type
Purchase Details
Closed on
Apr 14, 2015
Sold by
Vongchampa Thony and Vongchampa Bouaphet
Bought by
Khenmy Naly T and Khenmy Bobby T
Current Estimated Value
Purchase Details
Closed on
Jun 16, 1994
Sold by
Connecticut Rlty Co
Bought by
Raissi Mohammed S and Malekzadegan Afsar
Create a Home Valuation Report for This Property
The Home Valuation Report is an in-depth analysis detailing your home's value as well as a comparison with similar homes in the area
Home Values in the Area
Average Home Value in this Area
Purchase History
| Date | Buyer | Sale Price | Title Company |
|---|---|---|---|
| Khenmy Naly T | $61,000 | -- | |
| Raissi Mohammed S | $17,000 | -- |
Source: Public Records
Mortgage History
| Date | Status | Borrower | Loan Amount |
|---|---|---|---|
| Previous Owner | Raissi Mohammed S | $35,000 | |
| Previous Owner | Raissi Mohammed S | $20,000 | |
| Previous Owner | Raissi Mohammed S | $30,000 |
Source: Public Records
Tax History Compared to Growth
Tax History
| Year | Tax Paid | Tax Assessment Tax Assessment Total Assessment is a certain percentage of the fair market value that is determined by local assessors to be the total taxable value of land and additions on the property. | Land | Improvement |
|---|---|---|---|---|
| 2025 | $2,794 | $332,600 | $146,500 | $186,100 |
| 2024 | $4,272 | $232,800 | $71,300 | $161,500 |
| 2023 | $4,272 | $232,800 | $71,300 | $161,500 |
| 2022 | $4,144 | $232,800 | $71,300 | $161,500 |
| 2021 | $3,645 | $148,400 | $33,200 | $115,200 |
| 2020 | $3,645 | $148,400 | $33,200 | $115,200 |
| 2019 | $3,645 | $148,400 | $33,200 | $115,200 |
| 2018 | $3,209 | $100,400 | $27,400 | $73,000 |
| 2017 | $3,209 | $100,400 | $27,400 | $73,000 |
| 2016 | $3,209 | $100,400 | $27,400 | $73,000 |
| 2015 | $3,277 | $99,000 | $32,900 | $66,100 |
| 2014 | $3,341 | $99,000 | $32,900 | $66,100 |
| 2013 | $3,341 | $99,000 | $32,900 | $66,100 |
Source: Public Records
Map
Nearby Homes
- 13 Greenwood St
- 9 Greenwood St
- 28 Erastus St
- 30 Erastus St
- 24 Erastus St
- 17 Greenwood St
- 361 Manton Ave
- 10 Greenwood St
- 351 Manton Ave
- 351 Manton Ave Unit 2
- 349 Manton Ave
- 32 Erastus St Unit A
- 32 Erastus St Unit D
- 32 Erastus St Unit C
- 32 Erastus St Unit B
- 32 Erastus St Unit 32A
- 32 Erastus St
- 32 Erastus St Unit C
- 34 Erastus St Unit 34B
- 34 Erastus St Unit C