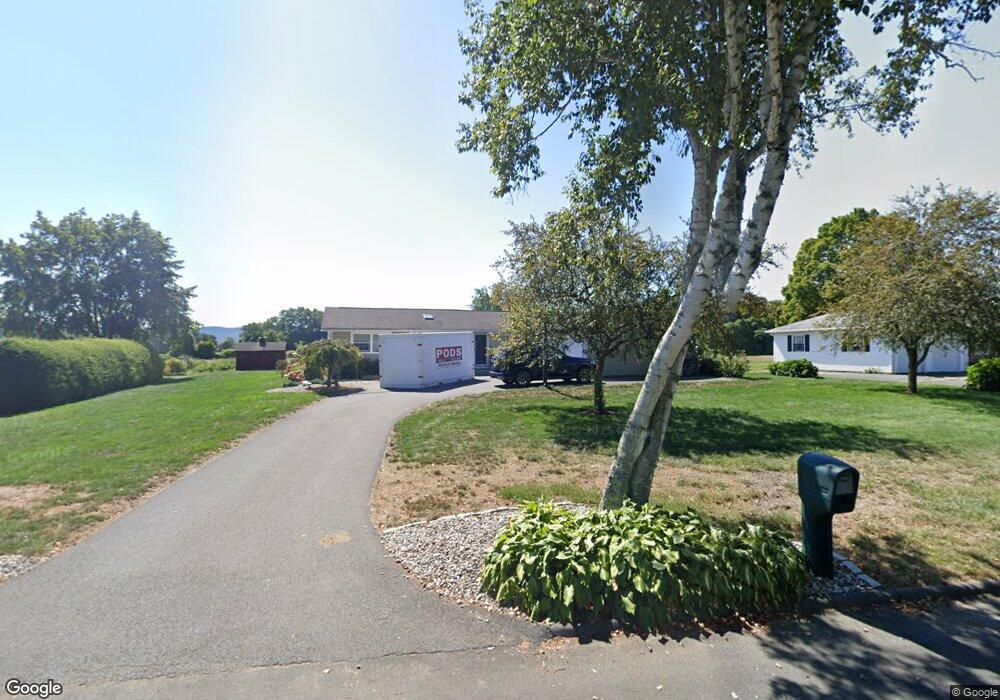
11 Hadley Place Hadley, MA 01035
Estimated Value: $461,373 - $542,000
3
Beds
2
Baths
1,616
Sq Ft
$312/Sq Ft
Est. Value
About This Home
This home is located at 11 Hadley Place, Hadley, MA 01035 and is currently estimated at $504,093, approximately $311 per square foot. 11 Hadley Place is a home located in Hampshire County with nearby schools including Hadley Elementary School, Hopkins Academy, and Pioneer Valley Chinese Immersion Charter School.
Ownership History
Date
Name
Owned For
Owner Type
Purchase Details
Closed on
Sep 4, 2001
Sold by
Triggs Gerald F and Triggs Michelle L
Bought by
Butterfield Daniel A and Butterfield Stacey E
Current Estimated Value
Home Financials for this Owner
Home Financials are based on the most recent Mortgage that was taken out on this home.
Original Mortgage
$140,000
Interest Rate
7.06%
Mortgage Type
Purchase Money Mortgage
Create a Home Valuation Report for This Property
The Home Valuation Report is an in-depth analysis detailing your home's value as well as a comparison with similar homes in the area
Home Values in the Area
Average Home Value in this Area
Purchase History
| Date | Buyer | Sale Price | Title Company |
|---|---|---|---|
| Butterfield Daniel A | $180,000 | -- |
Source: Public Records
Mortgage History
| Date | Status | Borrower | Loan Amount |
|---|---|---|---|
| Open | Butterfield Daniel A | $126,000 | |
| Closed | Butterfield Daniel A | $140,000 | |
| Previous Owner | Butterfield Daniel A | $50,000 |
Source: Public Records
Tax History Compared to Growth
Tax History
| Year | Tax Paid | Tax Assessment Tax Assessment Total Assessment is a certain percentage of the fair market value that is determined by local assessors to be the total taxable value of land and additions on the property. | Land | Improvement |
|---|---|---|---|---|
| 2025 | $4,346 | $373,700 | $120,300 | $253,400 |
| 2024 | $4,130 | $362,600 | $120,300 | $242,300 |
| 2023 | $3,961 | $343,200 | $120,300 | $222,900 |
| 2022 | $3,705 | $304,200 | $120,300 | $183,900 |
| 2021 | $3,410 | $284,200 | $120,300 | $163,900 |
| 2020 | $3,414 | $267,100 | $120,300 | $146,800 |
| 2019 | $3,301 | $267,100 | $120,300 | $146,800 |
| 2018 | $3,229 | $267,100 | $120,300 | $146,800 |
| 2017 | $3,116 | $269,300 | $120,300 | $149,000 |
| 2016 | $3,003 | $269,300 | $120,300 | $149,000 |
| 2015 | $2,925 | $269,300 | $120,300 | $149,000 |
| 2014 | $2,865 | $269,300 | $120,300 | $149,000 |
Source: Public Records
Map
Nearby Homes