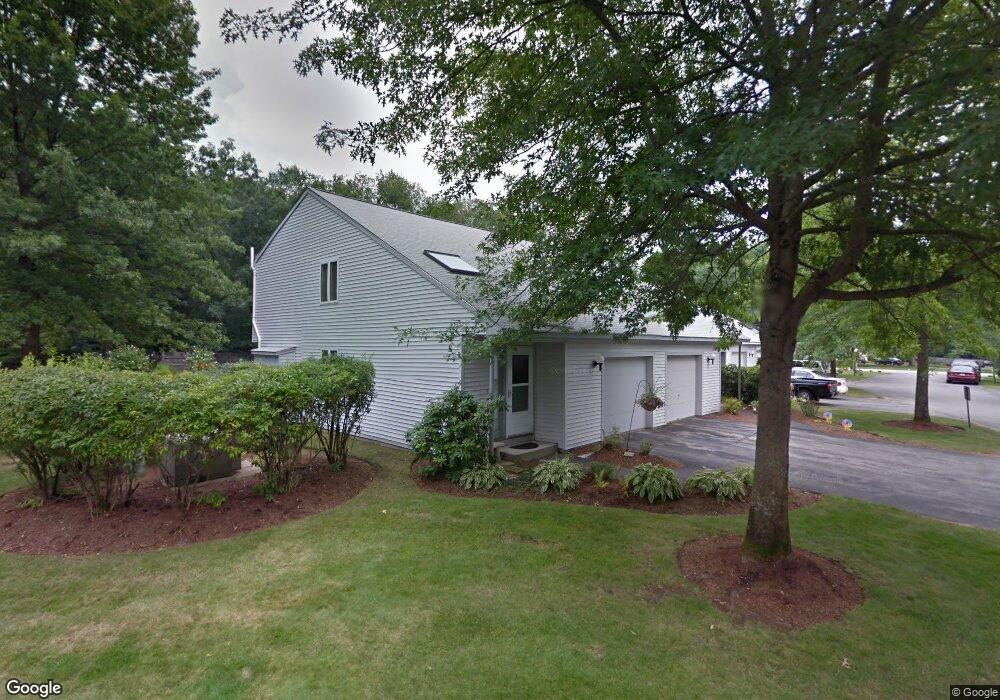
11 Highland Green Merrimack, NH 03054
Estimated Value: $347,000 - $379,000
2
Beds
2
Baths
1,499
Sq Ft
$240/Sq Ft
Est. Value
About This Home
This home is located at 11 Highland Green, Merrimack, NH 03054 and is currently estimated at $359,239, approximately $239 per square foot. 11 Highland Green is a home located in Hillsborough County with nearby schools including James Mastricola Elementary School, James Mastricola Upper Elementary School, and Merrimack Middle School.
Ownership History
Date
Name
Owned For
Owner Type
Purchase Details
Closed on
Apr 26, 2021
Sold by
Deluca-Killinger Carolann and Spanks Patricia A
Bought by
Imbornoue Carol A
Current Estimated Value
Purchase Details
Closed on
Apr 15, 2021
Sold by
Carol A Imbornone Ft
Bought by
Deluca Richard P and Spanks Patricia A
Purchase Details
Closed on
Jun 22, 2017
Sold by
Sergi Richard
Bought by
Carol Imbornone Ft
Purchase Details
Closed on
Jul 14, 2016
Sold by
Kelsey Dean H and Kelsey Darlene A
Bought by
Sergi Richard
Purchase Details
Closed on
Mar 10, 2003
Sold by
Patterson 1991 Rev T Dana
Bought by
Saulnier Annette I
Home Financials for this Owner
Home Financials are based on the most recent Mortgage that was taken out on this home.
Original Mortgage
$155,700
Interest Rate
5.95%
Purchase Details
Closed on
Jun 24, 2002
Sold by
Dana Patterson T
Bought by
Kelsey Dean H and Kelsey Darlene
Create a Home Valuation Report for This Property
The Home Valuation Report is an in-depth analysis detailing your home's value as well as a comparison with similar homes in the area
Home Values in the Area
Average Home Value in this Area
Purchase History
| Date | Buyer | Sale Price | Title Company |
|---|---|---|---|
| Imbornoue Carol A | -- | None Available | |
| Deluca Richard P | -- | None Available | |
| Carol Imbornone Ft | $190,000 | -- | |
| Sergi Richard | $150,000 | -- | |
| Saulnier Annette I | $164,000 | -- | |
| Kelsey Dean H | $149,900 | -- |
Source: Public Records
Mortgage History
| Date | Status | Borrower | Loan Amount |
|---|---|---|---|
| Previous Owner | Kelsey Dean H | $155,700 |
Source: Public Records
Tax History Compared to Growth
Tax History
| Year | Tax Paid | Tax Assessment Tax Assessment Total Assessment is a certain percentage of the fair market value that is determined by local assessors to be the total taxable value of land and additions on the property. | Land | Improvement |
|---|---|---|---|---|
| 2024 | $4,651 | $224,800 | $0 | $224,800 |
| 2023 | $4,372 | $224,800 | $0 | $224,800 |
| 2022 | $3,907 | $224,800 | $0 | $224,800 |
| 2021 | $3,860 | $224,800 | $0 | $224,800 |
| 2020 | $3,756 | $156,100 | $0 | $156,100 |
| 2019 | $3,641 | $150,900 | $0 | $150,900 |
| 2018 | $3,640 | $150,900 | $0 | $150,900 |
| 2017 | $3,316 | $141,900 | $0 | $141,900 |
| 2016 | $3,234 | $141,900 | $0 | $141,900 |
| 2015 | $3,535 | $143,000 | $0 | $143,000 |
| 2014 | $3,402 | $141,200 | $0 | $141,200 |
| 2013 | $3,854 | $161,200 | $0 | $161,200 |
Source: Public Records
Map
Nearby Homes
- 8 Highland Green Ln
- 7 Hadley Rd
- 3 Independence Dr
- 22 Clay St
- 98 Indian Rock Rd
- 5 Lynn Dr
- 5 Fernwood Dr
- 7 Beacon Dr
- 12 Clinton Ct
- 22 Essex Green Ct
- 11 Essex Green Ct
- 10 Kingston Ct Unit 10
- 38 Mallard Point
- 14 Mayflower Dr
- 343 Charles Bancroft Hwy
- 23 Pondview Dr
- 77 E Ridge Rd
- 19 Vista Way
- 40 Turkey Hill Rd
- 8 Donovan Ct
- 24 Highland Green
- 12 Highland Green
- 11 Highland Green Unit 11
- 24 Highland Green Unit 12
- 11 Highland Green Unit 19
- 3 Highland Ln
- 7 Highland Green Ln Unit 21
- 7 Highland Green Ln Unit 7
- 16 Highland Green Ln
- 1 Highland Green
- 3 Highland Green
- 5 Highland Green
- 7 Highland Green
- 9 Highland Green
- 36 Highland Green
- 22 Highland Green
- 20 Highland Green
- 18 Highland Green
- 16 Highland Green
- 14 Highland Green