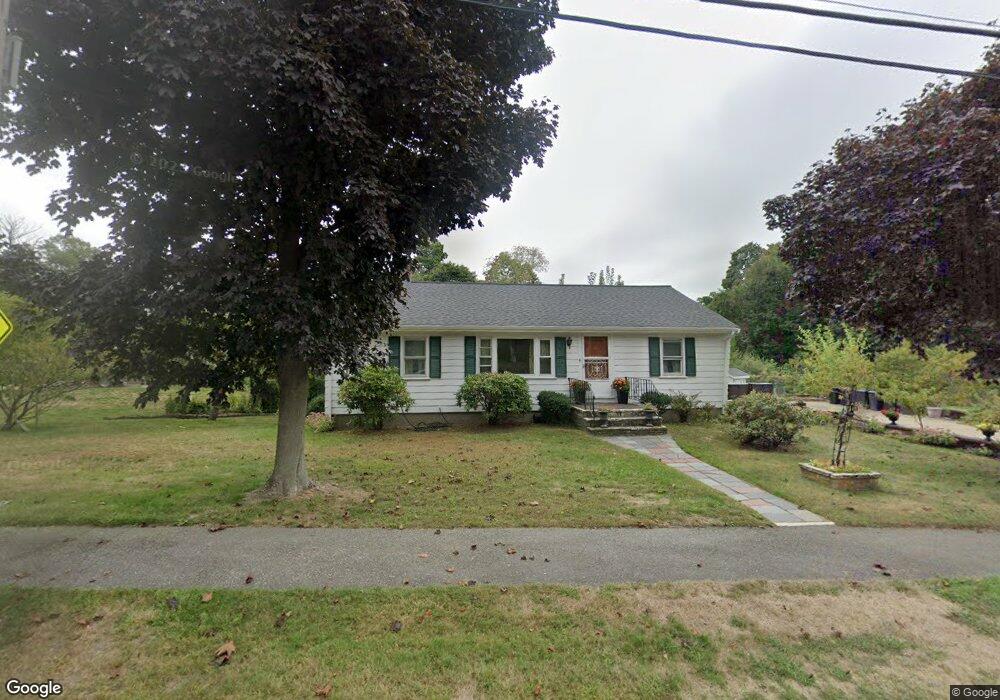
11 Hull St Cohasset, MA 02025
Estimated Value: $521,000 - $614,000
3
Beds
2
Baths
1,250
Sq Ft
$468/Sq Ft
Est. Value
About This Home
This home is located at 11 Hull St, Cohasset, MA 02025 and is currently estimated at $585,055, approximately $468 per square foot. 11 Hull St is a home located in Norfolk County with nearby schools including Joseph Osgood School, Deer Hill School, and Cohasset Middle School.
Ownership History
Date
Name
Owned For
Owner Type
Purchase Details
Closed on
Apr 10, 2024
Sold by
Catrambone Scott Est and Catrambone
Bought by
Halianne Catrambone Ret and Timmins
Current Estimated Value
Purchase Details
Closed on
Oct 22, 1982
Bought by
Catrambone Scott
Create a Home Valuation Report for This Property
The Home Valuation Report is an in-depth analysis detailing your home's value as well as a comparison with similar homes in the area
Home Values in the Area
Average Home Value in this Area
Purchase History
| Date | Buyer | Sale Price | Title Company |
|---|---|---|---|
| Halianne Catrambone Ret | -- | None Available | |
| Halianne Catrambone Ret | -- | None Available | |
| Halianne Catrambone Ret | -- | None Available | |
| Catrambone Scott | -- | -- |
Source: Public Records
Mortgage History
| Date | Status | Borrower | Loan Amount |
|---|---|---|---|
| Previous Owner | Catrambone Scott | $63,750 | |
| Previous Owner | Catrambone Scott | $255,000 |
Source: Public Records
Tax History Compared to Growth
Tax History
| Year | Tax Paid | Tax Assessment Tax Assessment Total Assessment is a certain percentage of the fair market value that is determined by local assessors to be the total taxable value of land and additions on the property. | Land | Improvement |
|---|---|---|---|---|
| 2025 | $4,911 | $424,100 | $262,400 | $161,700 |
| 2024 | $4,631 | $380,500 | $218,800 | $161,700 |
| 2023 | $4,480 | $379,700 | $218,700 | $161,000 |
| 2022 | $4,302 | $342,500 | $194,000 | $148,500 |
| 2021 | $4,466 | $342,500 | $194,000 | $148,500 |
| 2020 | $4,394 | $338,800 | $194,000 | $144,800 |
| 2019 | $4,371 | $338,800 | $194,000 | $144,800 |
| 2018 | $4,333 | $338,800 | $194,000 | $144,800 |
| 2017 | $4,096 | $313,600 | $184,800 | $128,800 |
| 2016 | $4,039 | $313,600 | $184,800 | $128,800 |
| 2015 | $3,986 | $313,600 | $184,800 | $128,800 |
| 2014 | $3,828 | $305,300 | $176,500 | $128,800 |
Source: Public Records
Map
Nearby Homes
- 114 Hull St
- 166 Hull St
- LOT 1B Rockland St
- 10 Chestnut Place
- 321 Rockland St
- 6 Grace Dr
- 45 Ocean Ledge Dr
- 10 Ocean Ledge Dr
- 101 Rockland St
- 152 Forest Ave
- 1 Gatehouse Ln Unit 1
- 8 Evergreen Ln
- 33 Turkey Hill Ln
- 1 Rockland St
- 29 Heather Dr
- 23 Wyola Rd
- 105 East St
- 20 Rockland House Rd Unit 203
- 247 Forest Ave
- 54 Salisbury St Waterfront