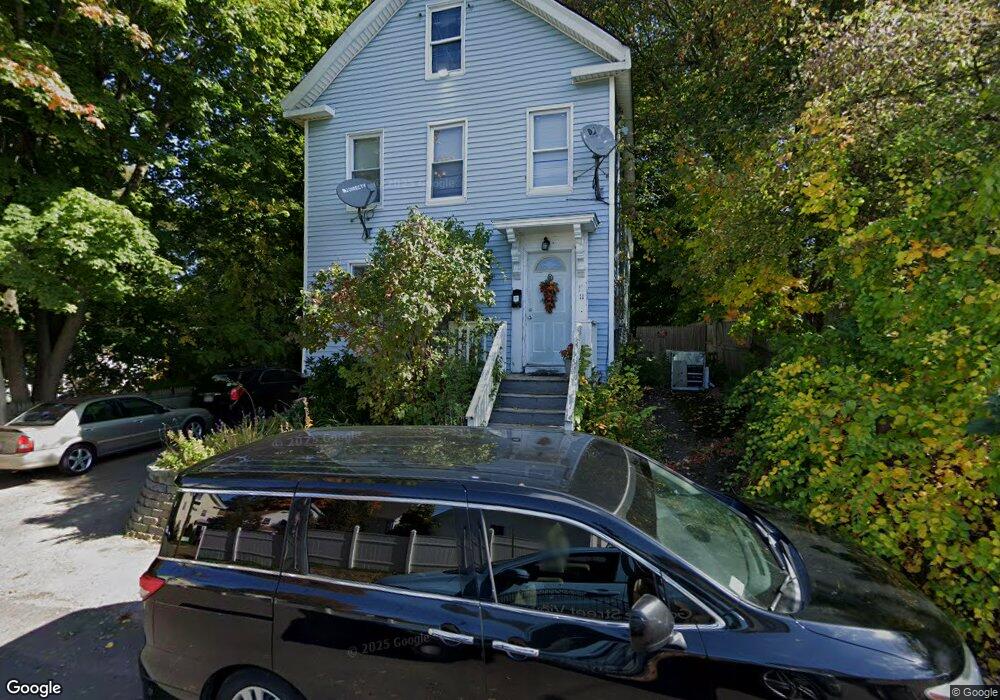
11 Kimball St Haverhill, MA 01830
Lower Acres NeighborhoodEstimated Value: $564,516 - $708,000
4
Beds
2
Baths
1,840
Sq Ft
$346/Sq Ft
Est. Value
About This Home
This home is located at 11 Kimball St, Haverhill, MA 01830 and is currently estimated at $636,629, approximately $345 per square foot. 11 Kimball St is a home located in Essex County with nearby schools including Pentucket Lake Elementary School.
Ownership History
Date
Name
Owned For
Owner Type
Purchase Details
Closed on
Jul 29, 2004
Sold by
Pylarinos Gerasimos M
Bought by
Pylarinos Katherine
Current Estimated Value
Purchase Details
Closed on
Jan 18, 1994
Sold by
Toussaint Alfred and Federal Home Loan Mortgage Cor
Bought by
Fhlmc
Purchase Details
Closed on
Jun 15, 1987
Sold by
Hatch Leonard M
Bought by
Toussaint Alfred P
Home Financials for this Owner
Home Financials are based on the most recent Mortgage that was taken out on this home.
Original Mortgage
$60,000
Interest Rate
10.76%
Create a Home Valuation Report for This Property
The Home Valuation Report is an in-depth analysis detailing your home's value as well as a comparison with similar homes in the area
Home Values in the Area
Average Home Value in this Area
Purchase History
| Date | Buyer | Sale Price | Title Company |
|---|---|---|---|
| Pylarinos Katherine | -- | -- | |
| Pylarinos Katherine | -- | -- | |
| Fhlmc | $65,000 | -- | |
| Fhlmc | $65,000 | -- | |
| Toussaint Alfred P | $133,900 | -- |
Source: Public Records
Mortgage History
| Date | Status | Borrower | Loan Amount |
|---|---|---|---|
| Open | Toussaint Alfred P | $120,000 | |
| Previous Owner | Toussaint Alfred P | $60,000 | |
| Closed | Toussaint Alfred P | $0 |
Source: Public Records
Tax History Compared to Growth
Tax History
| Year | Tax Paid | Tax Assessment Tax Assessment Total Assessment is a certain percentage of the fair market value that is determined by local assessors to be the total taxable value of land and additions on the property. | Land | Improvement |
|---|---|---|---|---|
| 2025 | $5,006 | $467,400 | $145,800 | $321,600 |
| 2024 | $4,706 | $442,300 | $144,300 | $298,000 |
| 2023 | $4,466 | $400,500 | $132,000 | $268,500 |
| 2022 | $4,294 | $337,600 | $119,700 | $217,900 |
| 2021 | $4,035 | $300,200 | $104,400 | $195,800 |
| 2020 | $3,837 | $282,100 | $96,700 | $185,400 |
| 2019 | $3,559 | $255,100 | $84,400 | $170,700 |
| 2018 | $3,404 | $238,700 | $79,800 | $158,900 |
| 2017 | $2,907 | $193,900 | $64,500 | $129,400 |
| 2016 | $2,978 | $193,900 | $64,500 | $129,400 |
| 2015 | $2,794 | $182,000 | $64,500 | $117,500 |
Source: Public Records
Map
Nearby Homes