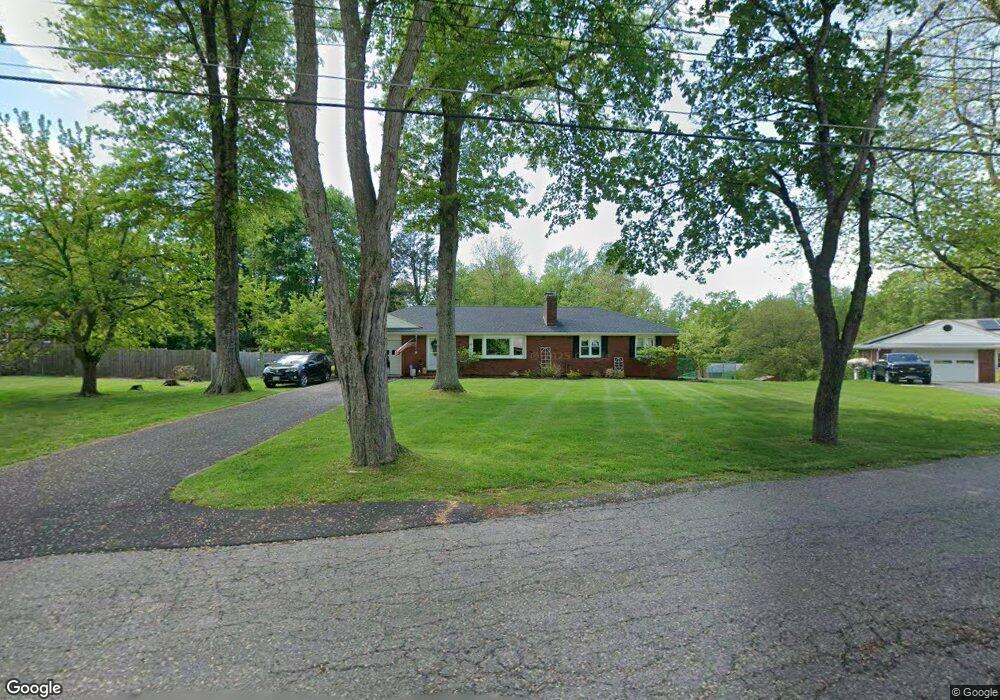
11 Lea Ln Wappingers Falls, NY 12590
Estimated Value: $368,000 - $447,703
3
Beds
2
Baths
1,484
Sq Ft
$279/Sq Ft
Est. Value
About This Home
This home is located at 11 Lea Ln, Wappingers Falls, NY 12590 and is currently estimated at $414,426, approximately $279 per square foot. 11 Lea Ln is a home located in Dutchess County with nearby schools including Beacon High School, The Randolph School, and St. Mary School.
Ownership History
Date
Name
Owned For
Owner Type
Purchase Details
Closed on
Mar 15, 2012
Sold by
Formichelli Gerard
Bought by
Richardson Peter
Current Estimated Value
Purchase Details
Closed on
Jun 5, 2002
Sold by
Financia Cendant Mobility
Bought by
Formichelli Gerard
Purchase Details
Closed on
May 13, 2002
Sold by
Reichert Timothy M
Bought by
Cendant Mobility Finan Co
Purchase Details
Closed on
Jan 2, 2002
Sold by
Guglielmo Angelo
Bought by
Reichert Timothy
Create a Home Valuation Report for This Property
The Home Valuation Report is an in-depth analysis detailing your home's value as well as a comparison with similar homes in the area
Home Values in the Area
Average Home Value in this Area
Purchase History
| Date | Buyer | Sale Price | Title Company |
|---|---|---|---|
| Richardson Peter | $200,000 | -- | |
| Formichelli Gerard | $234,500 | Frederick Romig, Esq | |
| Cendant Mobility Finan Co | $234,500 | Bruce Hofstetter | |
| Reichert Timothy | $205,000 | -- |
Source: Public Records
Tax History Compared to Growth
Tax History
| Year | Tax Paid | Tax Assessment Tax Assessment Total Assessment is a certain percentage of the fair market value that is determined by local assessors to be the total taxable value of land and additions on the property. | Land | Improvement |
|---|---|---|---|---|
| 2024 | $5,497 | $343,200 | $104,800 | $238,400 |
| 2023 | $8,143 | $341,800 | $104,800 | $237,000 |
| 2022 | $7,847 | $309,300 | $95,200 | $214,100 |
| 2021 | $7,813 | $281,200 | $84,700 | $196,500 |
| 2020 | $5,203 | $260,300 | $75,600 | $184,700 |
| 2019 | $5,171 | $260,300 | $75,600 | $184,700 |
| 2018 | $5,089 | $252,700 | $75,600 | $177,100 |
| 2017 | $4,901 | $239,600 | $75,600 | $164,000 |
| 2016 | $4,779 | $230,900 | $75,600 | $155,300 |
| 2015 | -- | $230,900 | $75,600 | $155,300 |
| 2014 | -- | $230,900 | $94,900 | $136,000 |
Source: Public Records
Map
Nearby Homes