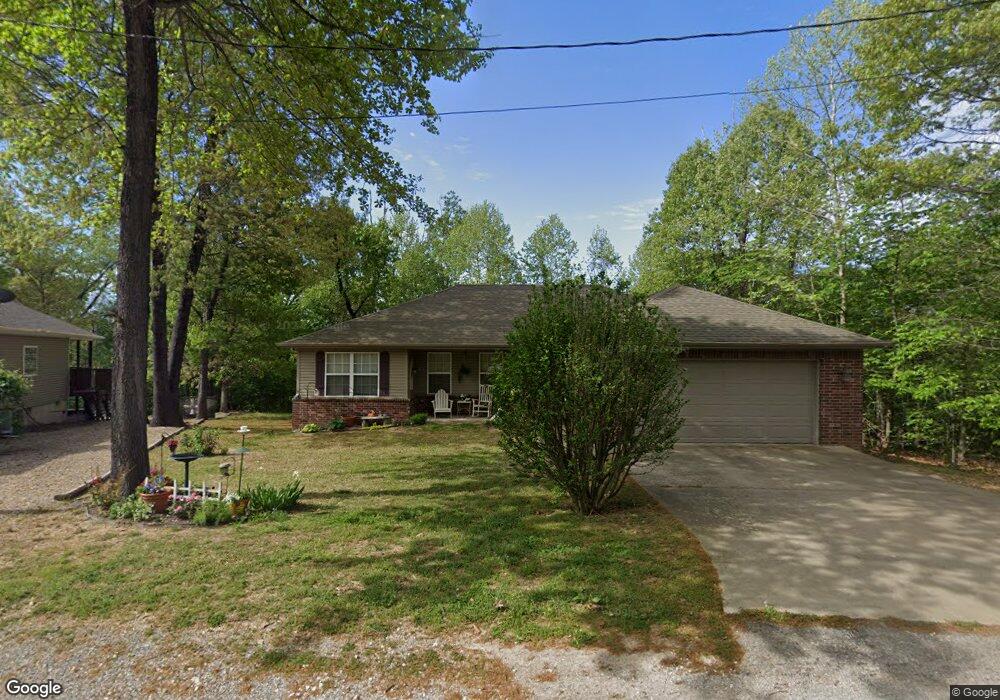
11 Retford Dr Bella Vista, AR 72715
Estimated Value: $285,579 - $347,000
--
Bed
2
Baths
1,396
Sq Ft
$226/Sq Ft
Est. Value
About This Home
This home is located at 11 Retford Dr, Bella Vista, AR 72715 and is currently estimated at $315,645, approximately $226 per square foot. 11 Retford Dr is a home located in Benton County with nearby schools including Thomas Jefferson Elementary School, Lincoln Junior High School, and Old High Middle School.
Ownership History
Date
Name
Owned For
Owner Type
Purchase Details
Closed on
Aug 28, 2006
Sold by
Spavinaw Construction Inc
Bought by
Herring Marlene L
Current Estimated Value
Home Financials for this Owner
Home Financials are based on the most recent Mortgage that was taken out on this home.
Original Mortgage
$84,000
Outstanding Balance
$50,323
Interest Rate
6.72%
Mortgage Type
Purchase Money Mortgage
Estimated Equity
$265,322
Purchase Details
Closed on
Sep 22, 2005
Sold by
Johnson Rick C and Johnson Yvonne A
Bought by
Spavinaw Construction Inc
Home Financials for this Owner
Home Financials are based on the most recent Mortgage that was taken out on this home.
Original Mortgage
$125,600
Interest Rate
5.76%
Mortgage Type
Construction
Purchase Details
Closed on
Apr 14, 2004
Bought by
Johnson
Purchase Details
Closed on
Oct 31, 2003
Bought by
Johnson
Purchase Details
Closed on
Jun 1, 1972
Bought by
Everson
Create a Home Valuation Report for This Property
The Home Valuation Report is an in-depth analysis detailing your home's value as well as a comparison with similar homes in the area
Home Values in the Area
Average Home Value in this Area
Purchase History
| Date | Buyer | Sale Price | Title Company |
|---|---|---|---|
| Herring Marlene L | $141,000 | Elite Title Company Inc | |
| Spavinaw Construction Inc | $8,000 | Bronson Title Services Inc | |
| Johnson | $1,700 | -- | |
| Johnson | -- | -- | |
| Everson | -- | -- |
Source: Public Records
Mortgage History
| Date | Status | Borrower | Loan Amount |
|---|---|---|---|
| Open | Herring Marlene L | $84,000 | |
| Previous Owner | Spavinaw Construction Inc | $125,600 |
Source: Public Records
Tax History Compared to Growth
Tax History
| Year | Tax Paid | Tax Assessment Tax Assessment Total Assessment is a certain percentage of the fair market value that is determined by local assessors to be the total taxable value of land and additions on the property. | Land | Improvement |
|---|---|---|---|---|
| 2025 | $1,538 | $52,375 | $1,600 | $50,775 |
| 2024 | $1,522 | $52,375 | $1,600 | $50,775 |
| 2023 | $1,522 | $35,450 | $800 | $34,650 |
| 2022 | $1,196 | $35,450 | $800 | $34,650 |
| 2021 | $1,193 | $35,450 | $800 | $34,650 |
| 2020 | $1,207 | $25,800 | $600 | $25,200 |
| 2019 | $1,207 | $25,800 | $600 | $25,200 |
| 2018 | $1,232 | $25,800 | $600 | $25,200 |
| 2017 | $1,172 | $25,800 | $600 | $25,200 |
| 2016 | $1,172 | $25,800 | $600 | $25,200 |
| 2015 | $1,497 | $24,830 | $1,000 | $23,830 |
| 2014 | $1,147 | $24,830 | $1,000 | $23,830 |
Source: Public Records
Map
Nearby Homes
- 27 Hermitage Ln
- 17 Hillington Cir
- 12 Claypole Ln
- Lot 17 of Block 3 Plymouth Dr
- 1 Devonshire Dr
- Lot 17 of Block 3 Halvergate Ln
- 6 Devonshire Dr
- 85 Rountree Dr
- Lot 21 of Block 3 Tillingham Ln
- Lot 53 of Block 3 Barford Ln
- 53 Belgravia Dr
- Lot 32 Belgravia Dr
- 0 Plymouth Cir
- Lot 27 Pimlico Dr
- 0 Hollis Cir Unit 1323079
- Lot 91 & 92 Maltby Ln
- 49 Clevelys Ln
- 105 Pimlico Dr
- 50 Leona Dr
- TBD (Lot 17) Pimlico Dr
- 15 Retford Dr
- 2 Butterwick Ln
- 21 Retford Dr
- 6 Butterwick Ln
- 24 Retford Dr
- Lot 12 Block 10 Butterwick Ln
- Lot #47 Butterwick Ln
- 0 Butterwick Ln
- 1 Butterwick Ln
- 20 Retford Dr
- 1 Hermitage Ln
- 2 Bourne Cir
- 2 Bourne Cir
- 5 Butterwick Ln
- -- Hermitage Ln
- Lot 33 Hermitage Ln
- 0 0 Hermitage Ln Unit 641378
- 000 Hermitage Ln
- 18 Retford Dr
- 14 Retford Dr