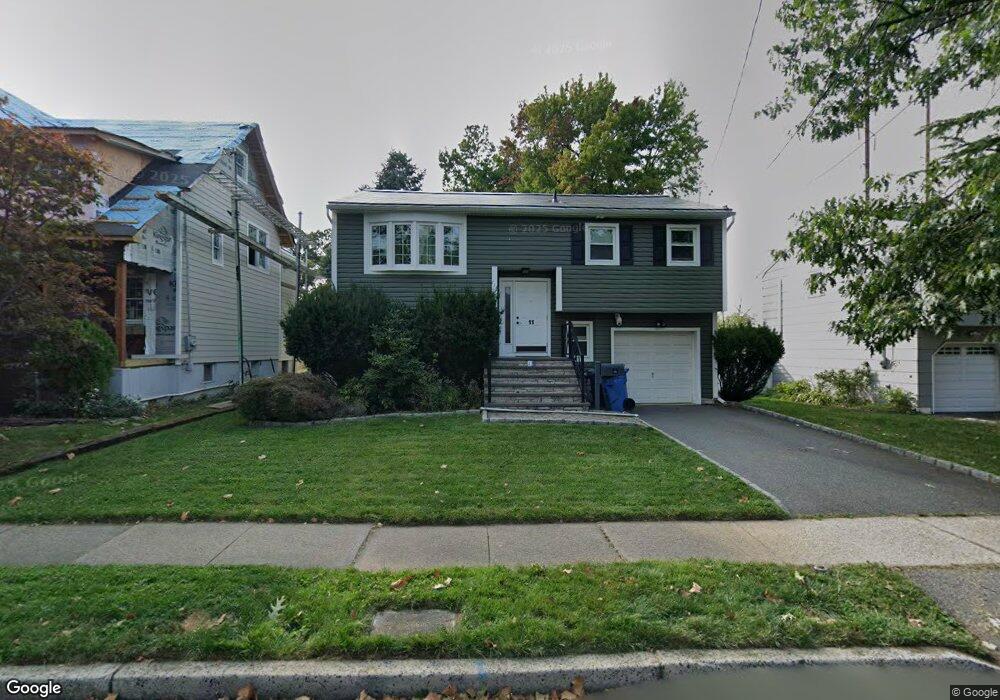
11 Rose St Metuchen, NJ 08840
Estimated Value: $689,131 - $845,000
--
Bed
--
Bath
1,438
Sq Ft
$533/Sq Ft
Est. Value
About This Home
This home is located at 11 Rose St, Metuchen, NJ 08840 and is currently estimated at $766,783, approximately $533 per square foot. 11 Rose St is a home located in Middlesex County with nearby schools including Edgar Middle School, Campbell Elementary School, and Metuchen High School.
Ownership History
Date
Name
Owned For
Owner Type
Purchase Details
Closed on
Jun 29, 2005
Sold by
Ladines Michael J
Bought by
Robertson Seth and Taylor Holly
Current Estimated Value
Home Financials for this Owner
Home Financials are based on the most recent Mortgage that was taken out on this home.
Original Mortgage
$408,000
Outstanding Balance
$212,017
Interest Rate
5.59%
Estimated Equity
$554,766
Purchase Details
Closed on
Apr 27, 2001
Sold by
Cox Timothy
Bought by
Ladines Michael
Home Financials for this Owner
Home Financials are based on the most recent Mortgage that was taken out on this home.
Original Mortgage
$150,000
Interest Rate
7.05%
Purchase Details
Closed on
Sep 25, 1995
Sold by
Febles Erinson
Bought by
Cox Timothy and Cox Crista Coventry
Home Financials for this Owner
Home Financials are based on the most recent Mortgage that was taken out on this home.
Original Mortgage
$173,000
Interest Rate
7.81%
Create a Home Valuation Report for This Property
The Home Valuation Report is an in-depth analysis detailing your home's value as well as a comparison with similar homes in the area
Home Values in the Area
Average Home Value in this Area
Purchase History
| Date | Buyer | Sale Price | Title Company |
|---|---|---|---|
| Robertson Seth | $510,000 | -- | |
| Ladines Michael | $230,000 | -- | |
| Cox Timothy | $182,500 | -- |
Source: Public Records
Mortgage History
| Date | Status | Borrower | Loan Amount |
|---|---|---|---|
| Open | Robertson Seth | $408,000 | |
| Previous Owner | Ladines Michael | $150,000 | |
| Previous Owner | Cox Timothy | $173,000 |
Source: Public Records
Tax History Compared to Growth
Tax History
| Year | Tax Paid | Tax Assessment Tax Assessment Total Assessment is a certain percentage of the fair market value that is determined by local assessors to be the total taxable value of land and additions on the property. | Land | Improvement |
|---|---|---|---|---|
| 2025 | $10,940 | $157,300 | $79,200 | $78,100 |
| 2024 | $10,574 | $157,300 | $79,200 | $78,100 |
| 2023 | $10,574 | $157,300 | $79,200 | $78,100 |
| 2022 | $10,022 | $157,300 | $79,200 | $78,100 |
| 2021 | $7,293 | $157,300 | $79,200 | $78,100 |
| 2020 | $9,663 | $157,300 | $79,200 | $78,100 |
| 2019 | $9,378 | $157,300 | $79,200 | $78,100 |
| 2018 | $9,344 | $157,300 | $79,200 | $78,100 |
| 2017 | $9,314 | $157,300 | $79,200 | $78,100 |
| 2016 | $9,076 | $157,300 | $79,200 | $78,100 |
| 2015 | $8,875 | $157,300 | $79,200 | $78,100 |
| 2014 | $8,653 | $157,300 | $79,200 | $78,100 |
Source: Public Records
Map
Nearby Homes