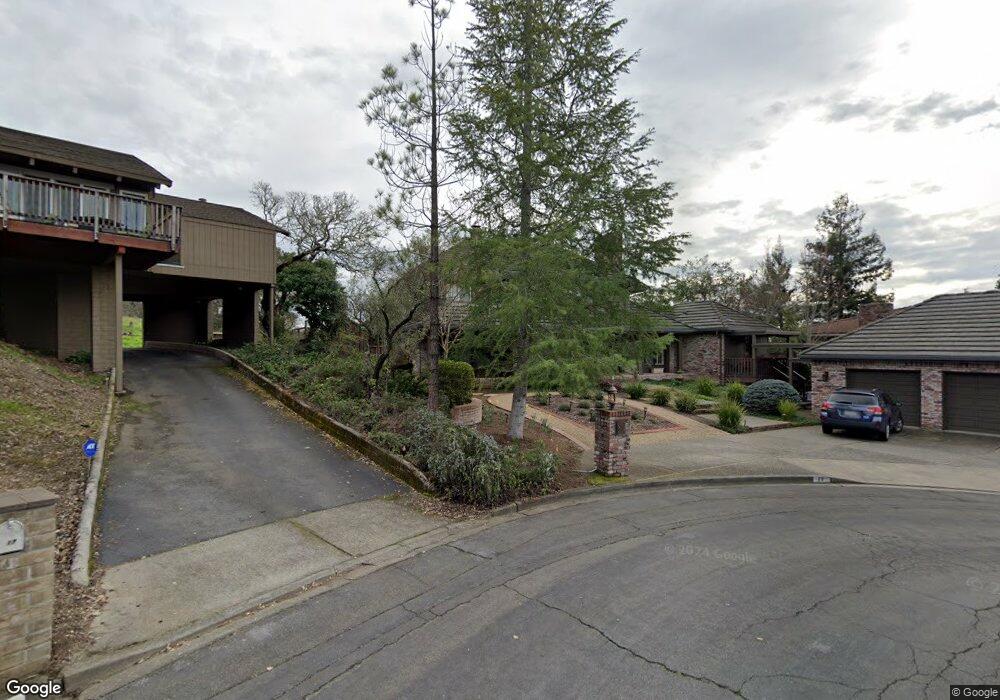
11 Saint Michael Cir Napa, CA 94558
Silverado Resort NeighborhoodEstimated Value: $2,068,000 - $2,678,000
3
Beds
4
Baths
3,615
Sq Ft
$650/Sq Ft
Est. Value
About This Home
This home is located at 11 Saint Michael Cir, Napa, CA 94558 and is currently estimated at $2,350,836, approximately $650 per square foot. 11 Saint Michael Cir is a home located in Napa County with nearby schools including Vichy Elementary School, Silverado Middle School, and Vintage High School.
Ownership History
Date
Name
Owned For
Owner Type
Purchase Details
Closed on
Jul 3, 2012
Sold by
Hull David N and Hull Pamela L
Bought by
Mooney Timothy J and Mooney Barbara J
Current Estimated Value
Home Financials for this Owner
Home Financials are based on the most recent Mortgage that was taken out on this home.
Original Mortgage
$907,500
Outstanding Balance
$732,087
Interest Rate
3.5%
Mortgage Type
New Conventional
Estimated Equity
$1,618,749
Purchase Details
Closed on
Aug 26, 2002
Sold by
Hull David N and Hull Pamela L
Bought by
Hull David N and Hull Pamela L
Purchase Details
Closed on
Mar 19, 1997
Sold by
Doshier Linda D
Bought by
Hull David N and Hull Pamela L
Home Financials for this Owner
Home Financials are based on the most recent Mortgage that was taken out on this home.
Original Mortgage
$285,000
Interest Rate
4.95%
Create a Home Valuation Report for This Property
The Home Valuation Report is an in-depth analysis detailing your home's value as well as a comparison with similar homes in the area
Home Values in the Area
Average Home Value in this Area
Purchase History
| Date | Buyer | Sale Price | Title Company |
|---|---|---|---|
| Mooney Timothy J | $1,210,000 | Old Republic Title Company | |
| Hull David N | -- | -- | |
| Hull David N | $615,000 | First American Title |
Source: Public Records
Mortgage History
| Date | Status | Borrower | Loan Amount |
|---|---|---|---|
| Open | Mooney Timothy J | $907,500 | |
| Previous Owner | Hull David N | $285,000 |
Source: Public Records
Tax History Compared to Growth
Tax History
| Year | Tax Paid | Tax Assessment Tax Assessment Total Assessment is a certain percentage of the fair market value that is determined by local assessors to be the total taxable value of land and additions on the property. | Land | Improvement |
|---|---|---|---|---|
| 2025 | $16,985 | $1,490,016 | $430,993 | $1,059,023 |
| 2024 | $16,985 | $1,460,801 | $422,543 | $1,038,258 |
| 2023 | $16,985 | $1,432,158 | $414,258 | $1,017,900 |
| 2022 | $16,445 | $1,404,078 | $406,136 | $997,942 |
| 2021 | $16,201 | $1,376,548 | $398,173 | $978,375 |
| 2020 | $16,074 | $1,362,434 | $394,091 | $968,343 |
| 2019 | $15,772 | $1,335,720 | $386,364 | $949,356 |
| 2018 | $15,587 | $1,309,531 | $378,789 | $930,742 |
| 2017 | $15,285 | $1,283,855 | $371,362 | $912,493 |
| 2016 | $15,041 | $1,258,682 | $364,081 | $894,601 |
| 2015 | $14,102 | $1,239,777 | $358,613 | $881,164 |
| 2014 | $13,902 | $1,215,493 | $351,589 | $863,904 |
Source: Public Records
Map
Nearby Homes
- 2186 Monticello Rd
- 2277 Monticello Rd
- 833 Augusta Cir Unit 34
- 14 Maui Way
- 2152 Monticello Rd
- 523 Westgate Dr
- 2134 Monticello Rd
- 2143 Monticello Rd
- 540 Westgate Dr
- 1166 Castle Oaks Dr
- 350 Deer Hollow Dr
- 1167 Castle Oaks Dr
- 346 Deer Hollow Dr
- 1101 Castle Oaks Dr
- 421 Bear Creek Cir
- 164 Bonnie Brook Dr Unit 17
- 1600 Atlas Peak Rd Unit 432
- 1600 Atlas Peak Rd Unit 428
- 1600 Atlas Peak Rd Unit 365
- 2863 Atlas Peak Rd
- 359 Saint Andrews Dr
- 23 Saint Michael Cir
- 353 Saint Andrews Dr
- 363 Saint Andrews Dr
- 358 Saint Andrews Dr
- 347 Saint Andrews Dr
- 350 Saint Andrews Dr
- 362 Saint Andrews Dr
- 369 Saint Andrews Dr
- 6 Gleneagle Cir
- 341 Saint Andrews Dr
- 371 St Andrews Dr
- 366 Saint Andrews Dr
- 371 Saint Andrews Dr
- 13 Colonial Cir
- 12 Gleneagle Cir
- 19 Colonial Cir
- 335 Saint Andrews Dr
- 377 Saint Andrews Dr
- 16 Gleneagle Cir