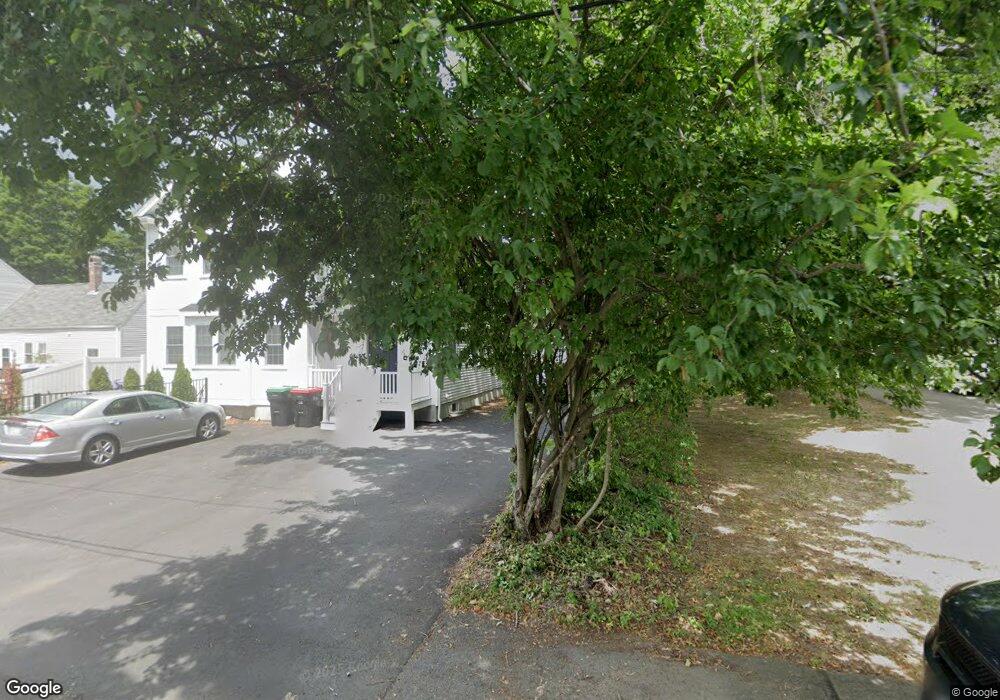
11 Shaw Place Foxboro, MA 02035
Estimated Value: $523,706 - $703,000
3
Beds
2
Baths
1,043
Sq Ft
$558/Sq Ft
Est. Value
About This Home
This home is located at 11 Shaw Place, Foxboro, MA 02035 and is currently estimated at $581,927, approximately $557 per square foot. 11 Shaw Place is a home located in Norfolk County with nearby schools including Foxborough High School, Foxborough Regional Charter School, and The Sage School.
Ownership History
Date
Name
Owned For
Owner Type
Purchase Details
Closed on
May 30, 2002
Sold by
Caron Jon M and Caron Krissanne M
Bought by
Hauber J Luke and Hauber Gretchen E
Current Estimated Value
Home Financials for this Owner
Home Financials are based on the most recent Mortgage that was taken out on this home.
Original Mortgage
$238,019
Outstanding Balance
$101,990
Interest Rate
7%
Mortgage Type
Purchase Money Mortgage
Estimated Equity
$479,937
Purchase Details
Closed on
Jan 22, 1999
Sold by
Stephanos Dale C
Bought by
Caron Jon M and Caron Krissanne M
Home Financials for this Owner
Home Financials are based on the most recent Mortgage that was taken out on this home.
Original Mortgage
$144,000
Interest Rate
6.7%
Mortgage Type
Purchase Money Mortgage
Purchase Details
Closed on
Sep 29, 1994
Sold by
Kelloway Harry E and Kelloway Kathleen
Bought by
Stephanos Dale C
Home Financials for this Owner
Home Financials are based on the most recent Mortgage that was taken out on this home.
Original Mortgage
$121,500
Interest Rate
8.5%
Mortgage Type
Purchase Money Mortgage
Create a Home Valuation Report for This Property
The Home Valuation Report is an in-depth analysis detailing your home's value as well as a comparison with similar homes in the area
Home Values in the Area
Average Home Value in this Area
Purchase History
| Date | Buyer | Sale Price | Title Company |
|---|---|---|---|
| Hauber J Luke | $239,900 | -- | |
| Caron Jon M | $160,000 | -- | |
| Stephanos Dale C | $135,000 | -- |
Source: Public Records
Mortgage History
| Date | Status | Borrower | Loan Amount |
|---|---|---|---|
| Open | Caron Jon M | $20,300 | |
| Open | Hauber J Luke | $238,019 | |
| Previous Owner | Caron Jon M | $144,000 | |
| Previous Owner | Stephanos Dale C | $121,500 |
Source: Public Records
Tax History Compared to Growth
Tax History
| Year | Tax Paid | Tax Assessment Tax Assessment Total Assessment is a certain percentage of the fair market value that is determined by local assessors to be the total taxable value of land and additions on the property. | Land | Improvement |
|---|---|---|---|---|
| 2025 | $5,386 | $407,400 | $204,900 | $202,500 |
| 2024 | $5,161 | $382,000 | $204,900 | $177,100 |
| 2023 | $5,042 | $354,800 | $195,100 | $159,700 |
| 2022 | $4,963 | $341,800 | $186,700 | $155,100 |
| 2021 | $4,677 | $317,300 | $169,700 | $147,600 |
| 2020 | $4,623 | $317,300 | $169,700 | $147,600 |
| 2019 | $4,456 | $303,100 | $161,600 | $141,500 |
| 2018 | $4,199 | $288,200 | $161,600 | $126,600 |
| 2017 | $3,954 | $262,900 | $151,100 | $111,800 |
| 2016 | $3,849 | $259,700 | $145,400 | $114,300 |
| 2015 | $3,714 | $244,500 | $122,800 | $121,700 |
| 2014 | $3,629 | $242,100 | $120,400 | $121,700 |
Source: Public Records
Map
Nearby Homes
- 24 Mechanic St
- 14 Baker St
- 11 Orchard Place Unit 11
- 84 Cocasset St Unit A6
- 11 W Belcher Rd Unit 2
- 18 Winter St Unit E
- 14 Winter St Unit B
- 14 Foxhill Rd
- 1 Eisenhauer Ln
- 12 Spring St
- 80 Mill St
- 73 Ridge Rd
- 356 Central St
- 186 Mechanic St
- 11 Goodwin Dr
- 35 Shoreline Dr
- 89 Oak St
- 9 Independence Dr Unit 9
- 132 Cannon Forge Dr
- 35 Independence Dr Unit 35