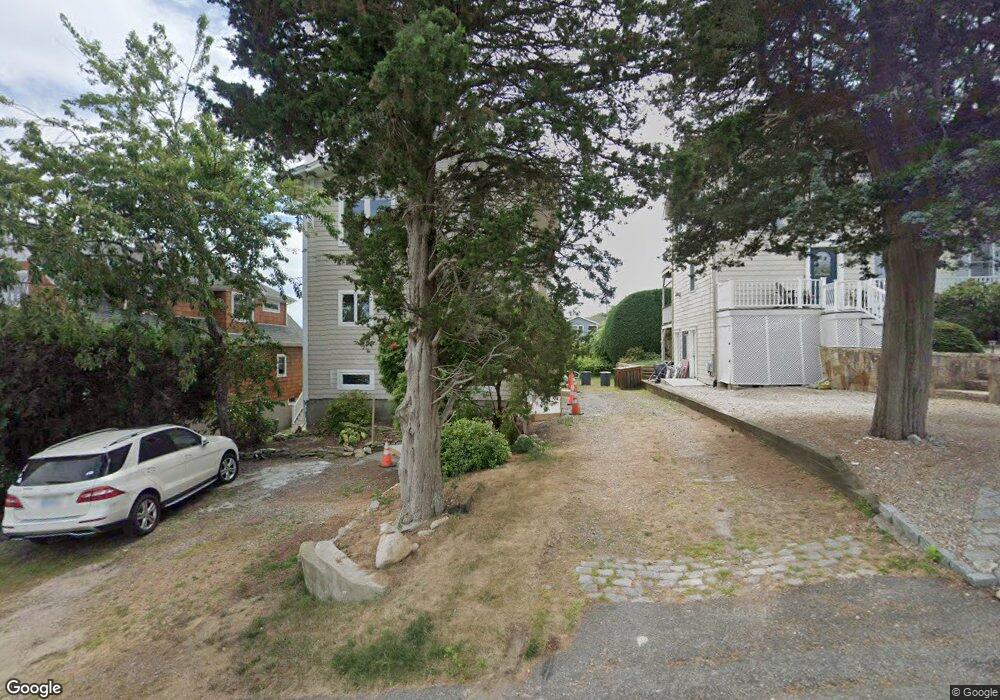
11 Spring St Narragansett, RI 02882
Estimated Value: $794,000 - $1,269,091
3
Beds
2
Baths
2,376
Sq Ft
$452/Sq Ft
Est. Value
About This Home
This home is located at 11 Spring St, Narragansett, RI 02882 and is currently estimated at $1,073,023, approximately $451 per square foot. 11 Spring St is a home located in Washington County with nearby schools including Narragansett Elementary School, Narragansett Pier Middle School, and Narragansett High School.
Ownership History
Date
Name
Owned For
Owner Type
Purchase Details
Closed on
Apr 12, 2007
Sold by
Parrillo Michael A
Bought by
Howard William N and Frobose Colleen
Current Estimated Value
Home Financials for this Owner
Home Financials are based on the most recent Mortgage that was taken out on this home.
Original Mortgage
$257,000
Outstanding Balance
$155,388
Interest Rate
6.24%
Mortgage Type
Purchase Money Mortgage
Estimated Equity
$917,635
Create a Home Valuation Report for This Property
The Home Valuation Report is an in-depth analysis detailing your home's value as well as a comparison with similar homes in the area
Home Values in the Area
Average Home Value in this Area
Purchase History
| Date | Buyer | Sale Price | Title Company |
|---|---|---|---|
| Howard William N | $390,000 | -- |
Source: Public Records
Mortgage History
| Date | Status | Borrower | Loan Amount |
|---|---|---|---|
| Open | Howard William N | $257,000 |
Source: Public Records
Tax History Compared to Growth
Tax History
| Year | Tax Paid | Tax Assessment Tax Assessment Total Assessment is a certain percentage of the fair market value that is determined by local assessors to be the total taxable value of land and additions on the property. | Land | Improvement |
|---|---|---|---|---|
| 2025 | $5,926 | $872,800 | $427,200 | $445,600 |
| 2024 | $5,717 | $872,800 | $427,200 | $445,600 |
| 2023 | $5,356 | $575,300 | $267,000 | $308,300 |
| 2022 | $5,178 | $575,300 | $267,000 | $308,300 |
| 2021 | $4,096 | $462,300 | $267,000 | $195,300 |
| 2020 | $4,092 | $390,500 | $212,300 | $178,200 |
| 2019 | $3,995 | $390,500 | $212,300 | $178,200 |
| 2018 | $3,885 | $390,500 | $212,300 | $178,200 |
| 2017 | $3,314 | $313,800 | $188,300 | $125,500 |
| 2016 | $3,163 | $313,800 | $188,300 | $125,500 |
| 2015 | $3,119 | $313,800 | $188,300 | $125,500 |
| 2014 | $3,307 | $329,400 | $203,900 | $125,500 |
Source: Public Records
Map
Nearby Homes
- 0 Betty Dr
- 175 Bonnet Point Rd Unit K13
- 91 Bonnet Point Rd
- 7 Leatherleaf Rd
- 74 Bayberry Rd
- 727 Boston Neck Rd
- 45 Leonard Bodwell Rd
- 51 Bonnet Shores Rd
- 53 Bonnet Shores Rd
- 55 Bonnet Shores Rd
- 264 Colonel John Gardner Rd
- 80 Old Pine Rd
- 11 Tupelo Trail
- 51 Osceola Ave
- 193 Bonnet Shores Rd
- 121 Spice Bush Trail
- 47 Wayland Trail
- 18 Anawan Ave
- 0 S River Dr
- 46 S River Dr