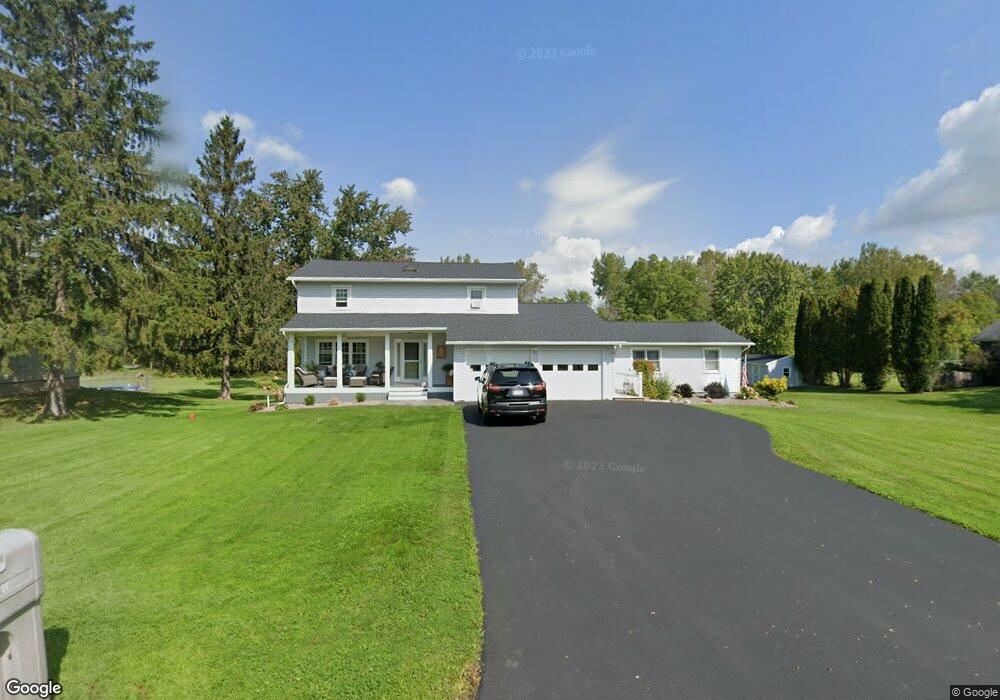
11 Taber Dr Auburn, NY 13021
Estimated Value: $340,000 - $407,000
6
Beds
4
Baths
2,472
Sq Ft
$153/Sq Ft
Est. Value
About This Home
This home is located at 11 Taber Dr, Auburn, NY 13021 and is currently estimated at $378,596, approximately $153 per square foot. 11 Taber Dr is a home located in Cayuga County with nearby schools including Auburn Junior High School, Auburn High School, and Creative Minds Montessori School.
Ownership History
Date
Name
Owned For
Owner Type
Purchase Details
Closed on
Jun 9, 2007
Sold by
Schattinger Robert
Bought by
Schattinger Robert
Current Estimated Value
Home Financials for this Owner
Home Financials are based on the most recent Mortgage that was taken out on this home.
Original Mortgage
$189,805
Outstanding Balance
$115,826
Interest Rate
6.14%
Mortgage Type
FHA
Estimated Equity
$262,770
Purchase Details
Closed on
Oct 26, 2001
Sold by
Pidlypchak John M
Bought by
Schattinger Robert C
Create a Home Valuation Report for This Property
The Home Valuation Report is an in-depth analysis detailing your home's value as well as a comparison with similar homes in the area
Home Values in the Area
Average Home Value in this Area
Purchase History
| Date | Buyer | Sale Price | Title Company |
|---|---|---|---|
| Schattinger Robert | -- | -- | |
| Schattinger Robert C | $140,000 | Samuel Giacona |
Source: Public Records
Mortgage History
| Date | Status | Borrower | Loan Amount |
|---|---|---|---|
| Open | Schattinger Robert | $189,805 |
Source: Public Records
Tax History Compared to Growth
Tax History
| Year | Tax Paid | Tax Assessment Tax Assessment Total Assessment is a certain percentage of the fair market value that is determined by local assessors to be the total taxable value of land and additions on the property. | Land | Improvement |
|---|---|---|---|---|
| 2024 | $5,854 | $251,100 | $29,500 | $221,600 |
| 2023 | $5,848 | $251,100 | $29,500 | $221,600 |
| 2022 | $6,052 | $251,100 | $29,500 | $221,600 |
| 2021 | $5,853 | $213,600 | $27,400 | $186,200 |
| 2020 | $5,225 | $213,600 | $27,400 | $186,200 |
| 2019 | $1,816 | $213,600 | $27,400 | $186,200 |
| 2018 | $5,113 | $213,600 | $27,400 | $186,200 |
| 2017 | $5,203 | $210,400 | $29,600 | $180,800 |
| 2016 | $8,193 | $210,400 | $29,600 | $180,800 |
| 2015 | $2,949 | $210,400 | $29,600 | $180,800 |
| 2014 | $2,949 | $210,400 | $29,600 | $180,800 |
Source: Public Records
Map
Nearby Homes