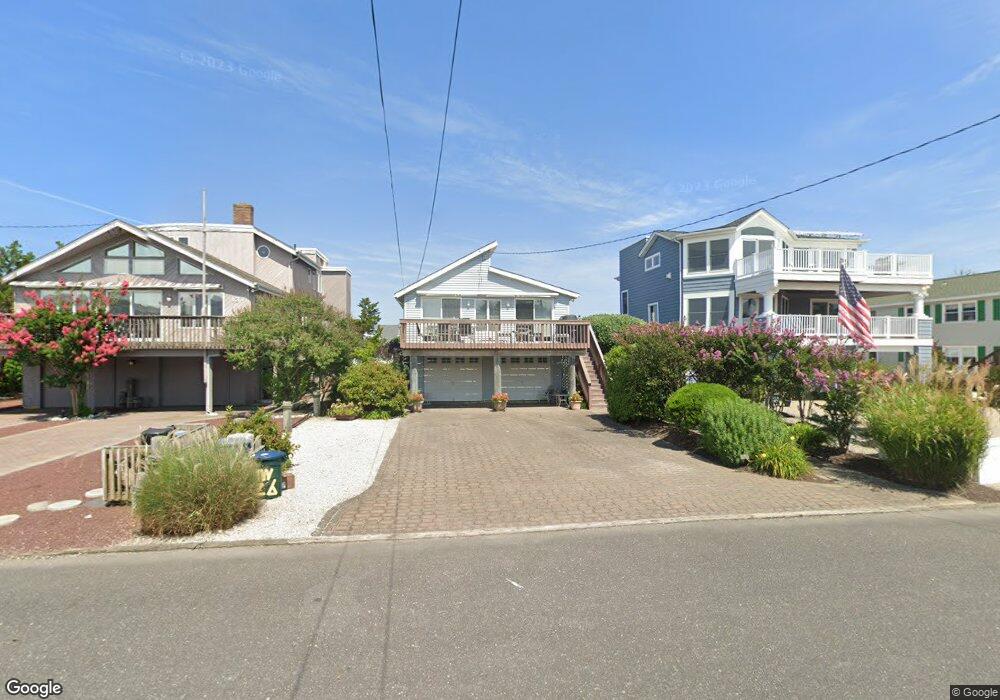
11 W 26th St Barnegat Light, NJ 08006
Long Beach Island NeighborhoodEstimated Value: $1,365,463 - $1,541,000
3
Beds
2
Baths
1,750
Sq Ft
$827/Sq Ft
Est. Value
About This Home
This home is located at 11 W 26th St, Barnegat Light, NJ 08006 and is currently estimated at $1,447,116, approximately $826 per square foot. 11 W 26th St is a home located in Ocean County with nearby schools including Ethel A. Jacobsen Elementary School, Long Beach Island Grade School, and Southern Regional Middle School.
Ownership History
Date
Name
Owned For
Owner Type
Purchase Details
Closed on
Nov 7, 2008
Sold by
Oppici Susan
Bought by
Cohn Lee S and Cohn Judith S
Current Estimated Value
Home Financials for this Owner
Home Financials are based on the most recent Mortgage that was taken out on this home.
Original Mortgage
$477,000
Outstanding Balance
$313,887
Interest Rate
6.13%
Mortgage Type
Purchase Money Mortgage
Estimated Equity
$1,133,229
Purchase Details
Closed on
May 5, 2000
Sold by
Nuber James
Bought by
Oppici Susan
Purchase Details
Closed on
Nov 1, 1993
Sold by
Callanan William F
Bought by
Nuber James D and Nuber Marilyn L
Home Financials for this Owner
Home Financials are based on the most recent Mortgage that was taken out on this home.
Original Mortgage
$189,000
Interest Rate
6.72%
Create a Home Valuation Report for This Property
The Home Valuation Report is an in-depth analysis detailing your home's value as well as a comparison with similar homes in the area
Home Values in the Area
Average Home Value in this Area
Purchase History
| Date | Buyer | Sale Price | Title Company |
|---|---|---|---|
| Cohn Lee S | $795,000 | Old Republic National Title | |
| Oppici Susan | $435,000 | -- | |
| Nuber James D | $236,500 | -- |
Source: Public Records
Mortgage History
| Date | Status | Borrower | Loan Amount |
|---|---|---|---|
| Open | Cohn Lee S | $477,000 | |
| Previous Owner | Nuber James D | $189,000 |
Source: Public Records
Tax History Compared to Growth
Tax History
| Year | Tax Paid | Tax Assessment Tax Assessment Total Assessment is a certain percentage of the fair market value that is determined by local assessors to be the total taxable value of land and additions on the property. | Land | Improvement |
|---|---|---|---|---|
| 2025 | $5,712 | $566,700 | $357,500 | $209,200 |
| 2024 | $5,049 | $566,700 | $357,500 | $209,200 |
| 2023 | $4,687 | $566,700 | $357,500 | $209,200 |
| 2022 | $4,687 | $566,700 | $357,500 | $209,200 |
| 2021 | $5,040 | $566,700 | $357,500 | $209,200 |
| 2020 | $5,117 | $566,700 | $357,500 | $209,200 |
| 2019 | $4,930 | $566,700 | $357,500 | $209,200 |
| 2018 | $4,845 | $566,700 | $357,500 | $209,200 |
| 2017 | $5,015 | $566,700 | $357,500 | $209,200 |
| 2016 | $4,885 | $566,700 | $357,500 | $209,200 |
| 2015 | $4,709 | $566,700 | $357,500 | $209,200 |
| 2014 | $5,126 | $567,000 | $357,500 | $209,500 |
Source: Public Records
Map
Nearby Homes