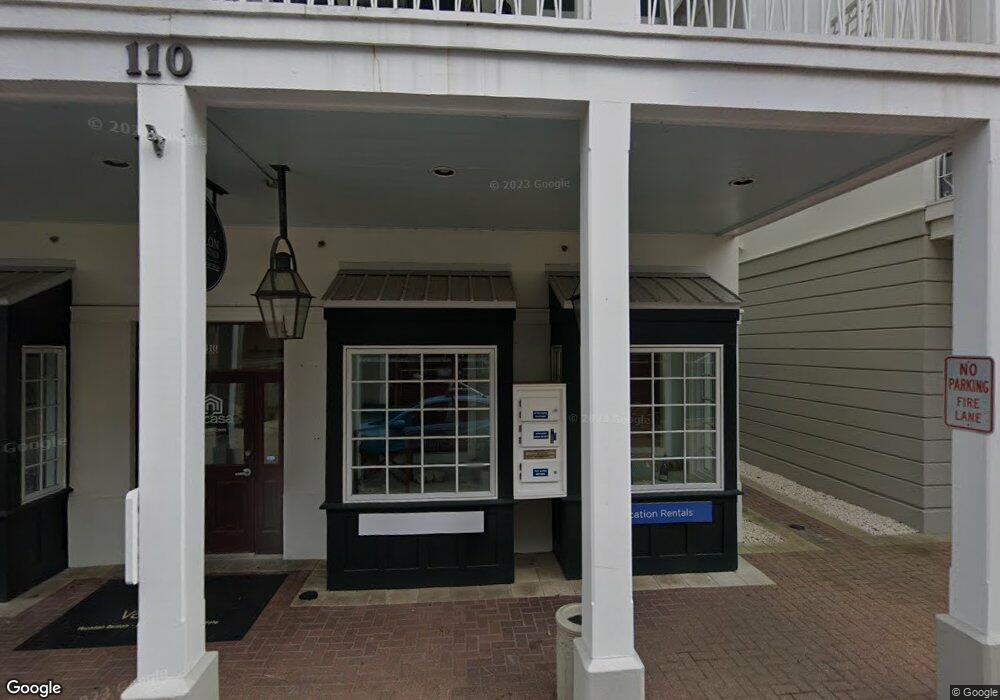
110 Carillon Market St Panama City Beach, FL 32413
Estimated Value: $816,980 - $875,000
3
Beds
4
Baths
3,300
Sq Ft
$258/Sq Ft
Est. Value
About This Home
This home is located at 110 Carillon Market St, Panama City Beach, FL 32413 and is currently estimated at $849,993, approximately $257 per square foot. 110 Carillon Market St is a home located in Bay County with nearby schools including Surfside Middle School, J.R. Arnold High School, and West Bay Elementary School.
Ownership History
Date
Name
Owned For
Owner Type
Purchase Details
Closed on
May 7, 2021
Sold by
Clapp Brian W
Bought by
Pneapple Doors Llc
Current Estimated Value
Purchase Details
Closed on
Apr 11, 2016
Sold by
Ava Kay Townhomes Llc
Bought by
Clapp Brian W
Home Financials for this Owner
Home Financials are based on the most recent Mortgage that was taken out on this home.
Original Mortgage
$371,071
Interest Rate
3.64%
Mortgage Type
Commercial
Purchase Details
Closed on
Jul 14, 2011
Sold by
Seacrest Beach Inc
Bought by
Ava Kay Townhomes Llc
Home Financials for this Owner
Home Financials are based on the most recent Mortgage that was taken out on this home.
Original Mortgage
$463,500
Interest Rate
4.52%
Mortgage Type
Future Advance Clause Open End Mortgage
Create a Home Valuation Report for This Property
The Home Valuation Report is an in-depth analysis detailing your home's value as well as a comparison with similar homes in the area
Home Values in the Area
Average Home Value in this Area
Purchase History
| Date | Buyer | Sale Price | Title Company |
|---|---|---|---|
| Pneapple Doors Llc | $649,200 | Defender T&E Agcy Llc | |
| Clapp Brian W | $450,000 | Attorney | |
| Ava Kay Townhomes Llc | $643,600 | South Walton Title Inc |
Source: Public Records
Mortgage History
| Date | Status | Borrower | Loan Amount |
|---|---|---|---|
| Previous Owner | Clapp Brian W | $371,071 | |
| Previous Owner | Ava Kay Townhomes Llc | $463,500 |
Source: Public Records
Tax History Compared to Growth
Tax History
| Year | Tax Paid | Tax Assessment Tax Assessment Total Assessment is a certain percentage of the fair market value that is determined by local assessors to be the total taxable value of land and additions on the property. | Land | Improvement |
|---|---|---|---|---|
| 2024 | $6,672 | $513,757 | $219,780 | $293,977 |
| 2023 | $6,672 | $517,689 | $219,780 | $297,909 |
| 2022 | $5,942 | $496,468 | $219,780 | $276,688 |
| 2021 | $4,618 | $368,374 | $99,000 | $269,374 |
| 2020 | $4,724 | $371,839 | $99,000 | $272,839 |
| 2019 | $4,824 | $375,303 | $99,000 | $276,303 |
| 2018 | $4,941 | $378,768 | $0 | $0 |
| 2017 | $5,017 | $382,233 | $0 | $0 |
| 2016 | $5,151 | $385,698 | $0 | $0 |
| 2015 | $5,870 | $429,614 | $0 | $0 |
| 2014 | $6,942 | $511,469 | $0 | $0 |
Source: Public Records
Map
Nearby Homes
- 111 Carillon Market St Unit 303
- 114 Carillon Market St Unit 411
- 114 Carillon Market St Unit 201
- 114 Carillon Market St Unit 409
- 114 Carillon Market St Unit 412
- 114 Carillon Market St Unit 402
- 101 Carillon Ave
- 116 Carillon Market St Unit 701
- 109 Parkshore Dr
- 101 Cain Rd Unit A
- 101 Cain Rd Unit B
- 210 Village Way
- 112 Carillon Ave
- 209 Dune Crest Ln
- 357 Beachside Dr
- 425 Lakefront Dr
- 430 Lakefront Dr
- 428 Lakefront Dr
- 300 Cain Rd Unit 320
- 423 Lakefront Dr
- 110 Carillon Market St Unit 110
- 110 Carillon Market St Unit 2
- 108 Carillon Market St Unit 2
- 111 Market St Unit 305
- 111 Carillon Market St Unit 301
- 111 Carillon Market St Unit 306
- 111 Carillon Market St Unit 304
- 111 Carillon Market St Unit 302
- 106 Carillon Market St
- 106 Carillon Market St Unit M-9
- 106 Carillon Market St Unit Suite 2
- 111 Carillon Market 306 St Unit 306
- 114 St
- 114 Carillon Market 203 St Unit 203
- 114 Carillon Market 305 St Unit 305
- 104 Carillon Market St Unit 2
- 0 Carillon Market St
- 11620 Carillon Market St
- 105 Market St Unit 304
- 105 Market St Unit 302