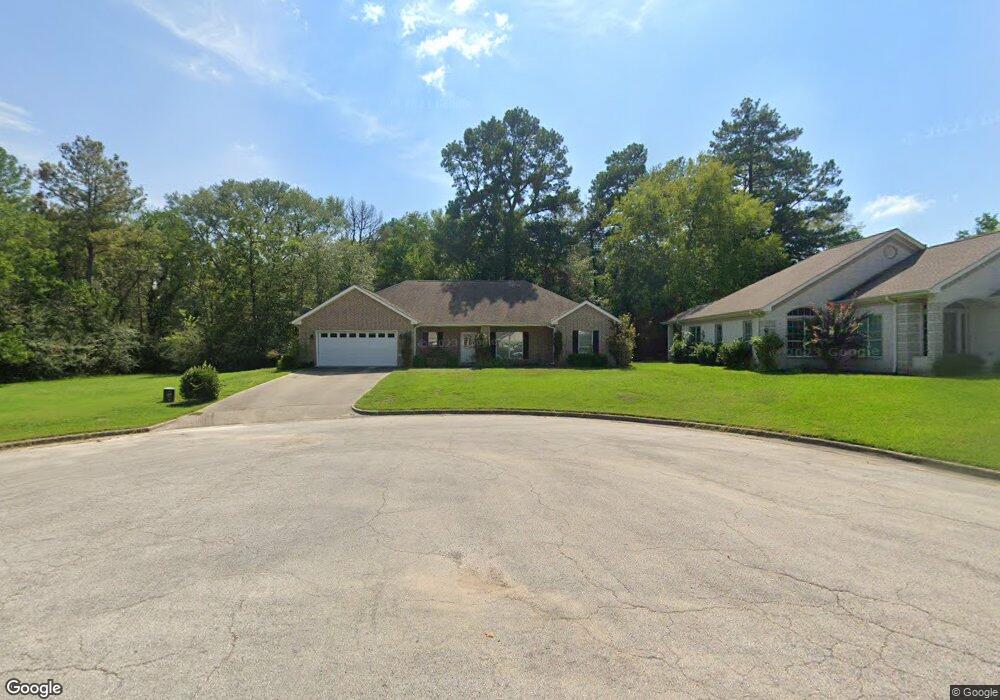
110 Jasmine Ct Lufkin, TX 75901
Estimated Value: $209,000 - $255,000
--
Bed
--
Bath
1,594
Sq Ft
$145/Sq Ft
Est. Value
About This Home
This home is located at 110 Jasmine Ct, Lufkin, TX 75901 and is currently estimated at $230,733, approximately $144 per square foot. 110 Jasmine Ct is a home with nearby schools including Slack Elementary School, Burley Primary School, and Lufkin Middle School.
Ownership History
Date
Name
Owned For
Owner Type
Purchase Details
Closed on
Mar 22, 2016
Sold by
Vandover Mark D and Vandover Kendra J
Bought by
Mcconnell Sheri L
Current Estimated Value
Purchase Details
Closed on
Sep 21, 2012
Sold by
Winson Land & Cattle I Ltd
Bought by
Vandover Mark D
Home Financials for this Owner
Home Financials are based on the most recent Mortgage that was taken out on this home.
Original Mortgage
$142,373
Interest Rate
3.37%
Mortgage Type
FHA
Create a Home Valuation Report for This Property
The Home Valuation Report is an in-depth analysis detailing your home's value as well as a comparison with similar homes in the area
Home Values in the Area
Average Home Value in this Area
Purchase History
| Date | Buyer | Sale Price | Title Company |
|---|---|---|---|
| Mcconnell Sheri L | -- | None Available | |
| Vandover Mark D | -- | Community Title |
Source: Public Records
Mortgage History
| Date | Status | Borrower | Loan Amount |
|---|---|---|---|
| Previous Owner | Vandover Mark D | $142,373 |
Source: Public Records
Tax History Compared to Growth
Tax History
| Year | Tax Paid | Tax Assessment Tax Assessment Total Assessment is a certain percentage of the fair market value that is determined by local assessors to be the total taxable value of land and additions on the property. | Land | Improvement |
|---|---|---|---|---|
| 2025 | $4,635 | $221,800 | $18,760 | $203,040 |
| 2024 | $4,579 | $219,100 | $18,760 | $200,340 |
| 2023 | $4,332 | $217,990 | $18,760 | $199,230 |
| 2022 | $4,816 | $214,340 | $13,870 | $200,470 |
| 2021 | $4,735 | $198,170 | $13,870 | $184,300 |
| 2020 | $4,295 | $174,750 | $13,870 | $160,880 |
| 2019 | $4,587 | $176,490 | $13,870 | $162,620 |
| 2018 | $3,378 | $172,560 | $13,870 | $158,690 |
| 2017 | $3,378 | $154,430 | $12,960 | $141,470 |
| 2016 | $3,573 | $149,880 | $12,960 | $136,920 |
| 2015 | $176 | $149,880 | $12,960 | $136,920 |
| 2014 | $176 | $149,470 | $12,960 | $136,510 |
Source: Public Records
Map
Nearby Homes
- 5100 Farm To Market 58
- 5552 S Chestnut St
- 3306 S Chestnut St
- 3106 S Chestnut St
- 1302 Parkman St
- 2210 Peachtree St
- 406 Forest Creek Dr
- 107 Eastwood Place
- 508 Forest Creek Dr
- 115 Willow Brook Dr
- 2707 S Chestnut St
- 110 Copperwood Loop
- 1808 Fuller Springs Dr
- R33234 Platt Rd
- 247 John James Rd
- 106 Oakwood Dr
- 102 Harmony Hill Ct
- 301 Sandybrook Dr
- 319 Sandybrook Dr
- 313 Sandybrook Dr
- 108 Jasmine Ct
- 106 Jasmine Ct
- 113 Jasmine Ct
- 111 Jasmine Ct
- 109 Jasmine Ct
- 110 Oak Shadows St
- 307 Ivy Terrace St
- 105 Jasmine Ct
- 305 Ivy Terrace St
- 0 Jasmine Ct
- 108 Oak Shadows St
- 110 Castle Ct
- 207 Ivy Terrace St
- 109 Castle Ct
- 109 Castle Ct
- 106 Oak Shadows St
- 203 Ivy Terrace St
- 201 Ivy Terrace St
- 108 Castle Ct
- 109 Oak Shadows St