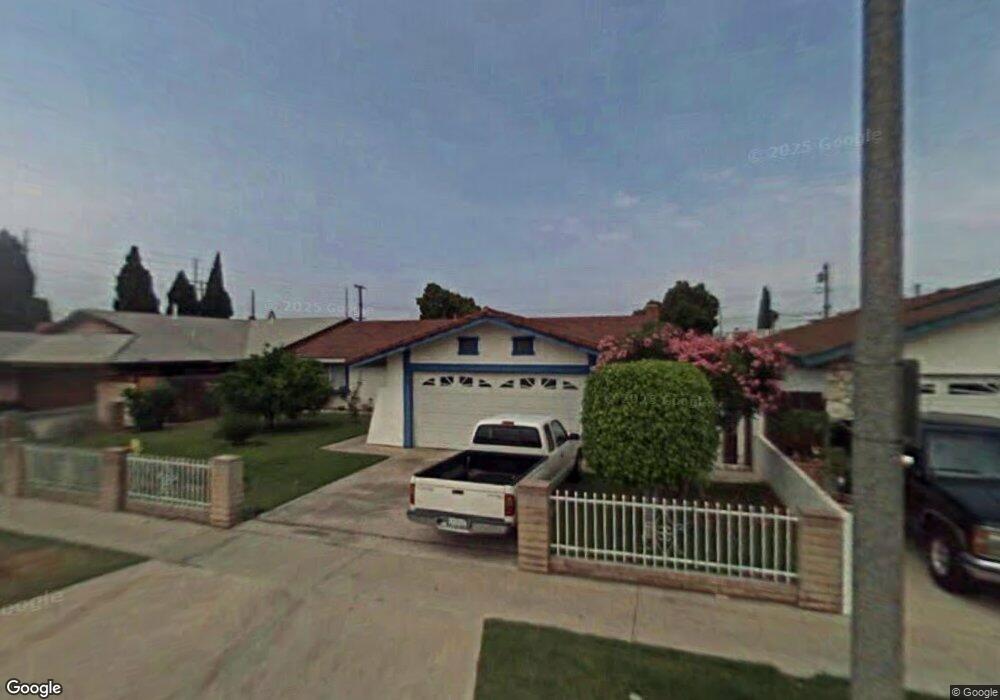
110 N Cooper St Santa Ana, CA 92703
Little Saigon NeighborhoodEstimated Value: $1,031,000 - $1,076,000
4
Beds
2
Baths
1,748
Sq Ft
$602/Sq Ft
Est. Value
About This Home
This home is located at 110 N Cooper St, Santa Ana, CA 92703 and is currently estimated at $1,052,918, approximately $602 per square foot. 110 N Cooper St is a home located in Orange County with nearby schools including Post Elementary, James Irvine Intermediate School, and La Quinta High School.
Ownership History
Date
Name
Owned For
Owner Type
Purchase Details
Closed on
Mar 13, 2019
Sold by
Nguyen Van Ai Thi and Tran Nhut
Bought by
Tran Nhut
Current Estimated Value
Purchase Details
Closed on
Apr 16, 2013
Sold by
Phu Van Bich
Bought by
Tran Nhut
Home Financials for this Owner
Home Financials are based on the most recent Mortgage that was taken out on this home.
Original Mortgage
$300,000
Outstanding Balance
$212,142
Interest Rate
3.51%
Mortgage Type
New Conventional
Estimated Equity
$840,776
Purchase Details
Closed on
Apr 13, 2013
Sold by
Nguyen Van Ai Thi and Tran Anh Quoc
Bought by
Nguyen Van Ai Thi and Tran Nhut
Home Financials for this Owner
Home Financials are based on the most recent Mortgage that was taken out on this home.
Original Mortgage
$300,000
Outstanding Balance
$212,142
Interest Rate
3.51%
Mortgage Type
New Conventional
Estimated Equity
$840,776
Purchase Details
Closed on
Oct 30, 1998
Sold by
Nguyen Van Althi
Bought by
Nguyen Van Althi and Tran Anh Quoc
Purchase Details
Closed on
Jun 26, 1998
Sold by
Thi Le Kim Hoa
Bought by
Nguyen Van Ai Thi
Home Financials for this Owner
Home Financials are based on the most recent Mortgage that was taken out on this home.
Original Mortgage
$148,500
Interest Rate
7.17%
Create a Home Valuation Report for This Property
The Home Valuation Report is an in-depth analysis detailing your home's value as well as a comparison with similar homes in the area
Home Values in the Area
Average Home Value in this Area
Purchase History
| Date | Buyer | Sale Price | Title Company |
|---|---|---|---|
| Tran Nhut | -- | None Available | |
| Tran Nhut | -- | Title365 | |
| Nguyen Van Ai Thi | -- | Title 365 | |
| Nguyen Van Althi | -- | -- | |
| Nguyen Van Ai Thi | $149,000 | Landwood Title |
Source: Public Records
Mortgage History
| Date | Status | Borrower | Loan Amount |
|---|---|---|---|
| Open | Nguyen Van Ai Thi | $300,000 | |
| Closed | Nguyen Van Ai Thi | $148,500 |
Source: Public Records
Tax History Compared to Growth
Tax History
| Year | Tax Paid | Tax Assessment Tax Assessment Total Assessment is a certain percentage of the fair market value that is determined by local assessors to be the total taxable value of land and additions on the property. | Land | Improvement |
|---|---|---|---|---|
| 2025 | $3,506 | $296,984 | $167,814 | $129,170 |
| 2024 | $3,506 | $291,161 | $164,523 | $126,638 |
| 2023 | $3,437 | $285,452 | $161,297 | $124,155 |
| 2022 | $3,361 | $279,855 | $158,134 | $121,721 |
| 2021 | $3,325 | $274,368 | $155,033 | $119,335 |
| 2020 | $3,279 | $271,555 | $153,443 | $118,112 |
| 2019 | $3,218 | $266,231 | $150,434 | $115,797 |
| 2018 | $3,153 | $261,011 | $147,484 | $113,527 |
| 2017 | $3,109 | $255,894 | $144,593 | $111,301 |
| 2016 | $2,976 | $250,877 | $141,758 | $109,119 |
| 2015 | $2,933 | $247,109 | $139,629 | $107,480 |
| 2014 | $2,860 | $242,269 | $136,894 | $105,375 |
Source: Public Records
Map
Nearby Homes
- 5405 W 4th St
- 10632 Henderson Ave
- 5317 Silver Dr
- 5132 W 1st St Unit B
- 5112 W 1st St Unit C
- 5114 W 1st St Unit C
- 323 N Euclid St Unit 99
- 4832 W 5th St Unit B
- 10581 Davit Ave
- 812 N Euclid St
- 10886 Lotus Dr
- 10562 Davit Ave
- 14356 Taft St
- 615 S Euclid St
- 13322 Euclid St
- 14376 Euclid St Unit 1-4
- 4518 W 1st St
- 14151 Lake St
- 9936 Pear Dr
- 4512 W Watkins Way
- 122 N Cooper St
- 106 N Cooper St
- 126 N Cooper St
- 14942 Starboard St
- 14952 Starboard St
- 102 N Cooper St
- 14922 Starboard St
- 202 N Cooper St
- 5428 W 2nd St
- 14972 Starboard St
- 14912 Starboard St
- 206 N Cooper St
- 5425 W 1st St Unit A
- 5425 W 1st St
- 5424 W 2nd St
- 14902 Starboard St
- 201 N Cooper St
- 210 N Cooper St
- 14941 Starboard St
- 5423 W 1st St