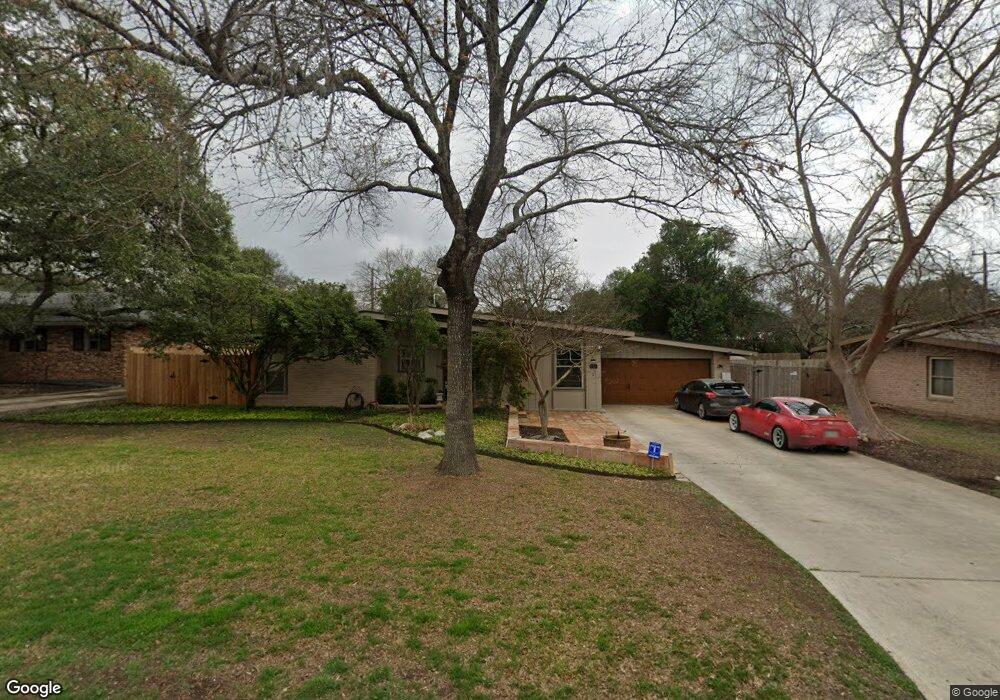
110 Oakhurst Place San Antonio, TX 78209
Oak Park-Northwood NeighborhoodEstimated Value: $629,552 - $765,000
3
Beds
3
Baths
2,417
Sq Ft
$285/Sq Ft
Est. Value
About This Home
This home is located at 110 Oakhurst Place, San Antonio, TX 78209 and is currently estimated at $688,888, approximately $285 per square foot. 110 Oakhurst Place is a home located in Bexar County with nearby schools including Woodridge Elementary School, Alamo Heights Junior School, and Alamo Heights High School.
Ownership History
Date
Name
Owned For
Owner Type
Purchase Details
Closed on
Aug 1, 2007
Sold by
Johnson Kevin A and Johnson Sandra L
Bought by
Worrel Charles Joseph and Worrel Laura Ann
Current Estimated Value
Home Financials for this Owner
Home Financials are based on the most recent Mortgage that was taken out on this home.
Original Mortgage
$306,375
Outstanding Balance
$194,674
Interest Rate
6.73%
Mortgage Type
Purchase Money Mortgage
Estimated Equity
$494,214
Purchase Details
Closed on
May 28, 2004
Sold by
Buzzini Walter J and Hetrick Buzzini Katherine A
Bought by
Johnson Kevin A and Johnson Sandra L
Purchase Details
Closed on
Dec 29, 1993
Sold by
Mauze George W and Mauze Rhae Chell
Bought by
Buzzini Walter J and Hetrick Katherine A
Home Financials for this Owner
Home Financials are based on the most recent Mortgage that was taken out on this home.
Original Mortgage
$105,000
Interest Rate
7.12%
Create a Home Valuation Report for This Property
The Home Valuation Report is an in-depth analysis detailing your home's value as well as a comparison with similar homes in the area
Home Values in the Area
Average Home Value in this Area
Purchase History
| Date | Buyer | Sale Price | Title Company |
|---|---|---|---|
| Worrel Charles Joseph | -- | Commerce Title Company | |
| Johnson Kevin A | -- | Commerce Title Company | |
| Buzzini Walter J | -- | -- |
Source: Public Records
Mortgage History
| Date | Status | Borrower | Loan Amount |
|---|---|---|---|
| Open | Worrel Charles Joseph | $306,375 | |
| Previous Owner | Buzzini Walter J | $105,000 | |
| Closed | Johnson Kevin A | $0 |
Source: Public Records
Tax History Compared to Growth
Tax History
| Year | Tax Paid | Tax Assessment Tax Assessment Total Assessment is a certain percentage of the fair market value that is determined by local assessors to be the total taxable value of land and additions on the property. | Land | Improvement |
|---|---|---|---|---|
| 2025 | $10,881 | $570,000 | $385,250 | $184,750 |
| 2024 | $10,881 | $585,000 | $385,250 | $199,750 |
| 2023 | $10,881 | $574,750 | $385,250 | $194,750 |
| 2022 | $12,649 | $522,500 | $265,990 | $264,010 |
| 2021 | $11,854 | $475,000 | $231,370 | $243,630 |
| 2020 | $11,367 | $455,000 | $231,370 | $223,630 |
| 2019 | $11,640 | $455,000 | $231,370 | $223,630 |
| 2018 | $11,147 | $445,000 | $128,620 | $316,380 |
| 2017 | $10,305 | $411,400 | $128,620 | $298,380 |
| 2016 | $9,368 | $374,000 | $85,750 | $291,250 |
| 2015 | $8,199 | $364,683 | $85,750 | $287,340 |
| 2014 | $8,199 | $331,530 | $0 | $0 |
Source: Public Records
Map
Nearby Homes
- 126 Treasure Way
- 8401 N New Braunfels Ave Unit 229 A
- 8401 N New Braunfels Ave Unit 343
- 8401 N New Braunfels Ave Unit 145
- 8401 N New Braunfels Ave Unit 314
- 2434 Toftrees Dr
- 8218 Country Lane Ct
- 134 Rockhill Dr
- 8033 N New Braunfels Ave Unit 400D
- 8033 N New Braunfels Ave Unit 500C
- 8033 N New Braunfels Ave Unit 300E
- 235 Escondida Place
- 2300 Nacogdoches Rd Unit O-160
- 2300 Nacogdoches Rd Unit C210
- 1815 Edgehill Dr
- 1835 Flamingo Dr
- 227 E Sunset Rd
- 1802 Edgehill Dr
- 8058 Broadway Unit 138N
- 8058 Broadway Unit 247 U
- 106 Oakhurst Place
- 106 Oakhurst Place Unit 106
- 118 Oakhurst Place
- 107 Oak Park Dr
- 111 Oak Park Dr
- 119 Oak Park Dr
- 103 Oak Park Dr
- 103 Oak Park Dr
- 107 Oakhurst Place
- 126 Oakhurst Place
- 111 Oakhurst Place
- 103 Oakhurst Place
- 119 Oakhurst Place
- 127 Oak Park Dr
- 8410 N New Braunfels Ave Unit 211A
- 134 Oakhurst Place
- 135 Oakhurst Place
- 135 Oak Park Dr
- 110 Oak Park Dr
- 102 Laburnum Dr