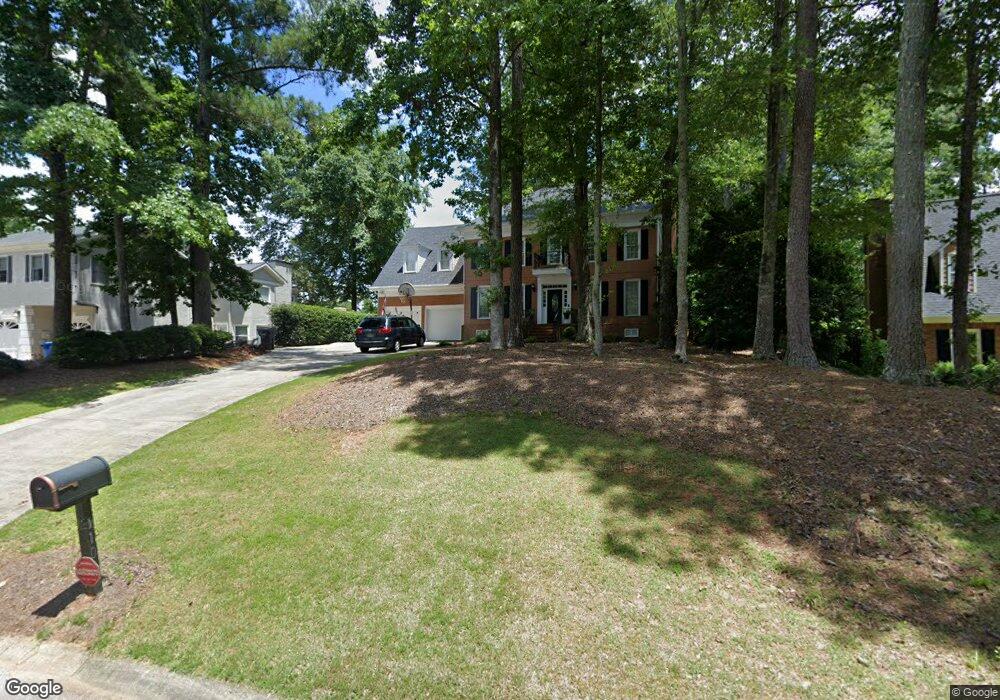
110 Sandtrap Ridge Peachtree City, GA 30269
Estimated Value: $723,881 - $796,000
--
Bed
1
Bath
3,285
Sq Ft
$231/Sq Ft
Est. Value
About This Home
This home is located at 110 Sandtrap Ridge, Peachtree City, GA 30269 and is currently estimated at $758,470, approximately $230 per square foot. 110 Sandtrap Ridge is a home located in Fayette County with nearby schools including Peachtree City Elementary School, Booth Middle School, and McIntosh High School.
Ownership History
Date
Name
Owned For
Owner Type
Purchase Details
Closed on
Jun 13, 2008
Sold by
Hemenway John
Bought by
Hemenway John and Hemenway Kristine
Current Estimated Value
Home Financials for this Owner
Home Financials are based on the most recent Mortgage that was taken out on this home.
Original Mortgage
$351,443
Outstanding Balance
$225,404
Interest Rate
6.04%
Mortgage Type
FHA
Estimated Equity
$533,066
Purchase Details
Closed on
Mar 7, 2002
Sold by
Ballard Randall M
Bought by
'Ballard Randall M and 'Ballard Amy H
Home Financials for this Owner
Home Financials are based on the most recent Mortgage that was taken out on this home.
Original Mortgage
$236,800
Interest Rate
5.46%
Mortgage Type
New Conventional
Purchase Details
Closed on
Jul 26, 1995
Sold by
Engle Lewis Susan
Bought by
Sorenson Marshall Jennifer
Create a Home Valuation Report for This Property
The Home Valuation Report is an in-depth analysis detailing your home's value as well as a comparison with similar homes in the area
Home Values in the Area
Average Home Value in this Area
Purchase History
| Date | Buyer | Sale Price | Title Company |
|---|---|---|---|
| Hemenway John | -- | -- | |
| Hemenway John | $361,400 | -- | |
| 'Ballard Randall M | -- | -- | |
| Ballard Randall M | $296,000 | -- | |
| Sorenson Marshall Jennifer | $205,000 | -- |
Source: Public Records
Mortgage History
| Date | Status | Borrower | Loan Amount |
|---|---|---|---|
| Open | Hemenway John | $351,443 | |
| Previous Owner | Ballard Randall M | $236,800 | |
| Closed | Sorenson Marshall Jennifer | $0 |
Source: Public Records
Tax History Compared to Growth
Tax History
| Year | Tax Paid | Tax Assessment Tax Assessment Total Assessment is a certain percentage of the fair market value that is determined by local assessors to be the total taxable value of land and additions on the property. | Land | Improvement |
|---|---|---|---|---|
| 2024 | $6,213 | $257,976 | $42,000 | $215,976 |
| 2023 | $5,687 | $247,440 | $42,000 | $205,440 |
| 2022 | $6,381 | $272,000 | $42,000 | $230,000 |
| 2021 | $5,785 | $219,700 | $28,500 | $191,200 |
| 2020 | $6,078 | $197,700 | $28,500 | $169,200 |
| 2019 | $5,683 | $183,220 | $28,500 | $154,720 |
| 2018 | $5,579 | $177,060 | $28,500 | $148,560 |
| 2017 | $5,196 | $163,940 | $28,500 | $135,440 |
| 2016 | $4,297 | $131,020 | $28,500 | $102,520 |
| 2015 | $4,062 | $121,980 | $28,500 | $93,480 |
| 2014 | -- | $115,420 | $28,500 | $86,920 |
| 2013 | -- | $111,580 | $0 | $0 |
Source: Public Records
Map
Nearby Homes
- 106 Sandtrap Ridge
- 103 Greensway
- 108 Madison Ave
- 1000 Blair Ln
- 930 Laurel Brooke Ave
- 221 N Cove Dr
- 330 N Peachtree Pkwy
- 406 Daker Dr
- 527 Hazelnut Dr
- 110 Paddock Trail
- 940 Laurel Brooke Ave
- Level Three Plan at Laurel Brooke - The Enclave at Laurel Brooke
- Level Two Plan at Laurel Brooke - The Enclave at Laurel Brooke
- Level One Plan at Laurel Brooke - The Enclave at Laurel Brooke
- 115 Edgewater Way
- 15 Perthshire Dr
- 404 Journeys End
- 124 Middleton Dr
- 20 Fairway Ln
- 12 Northlake Cir
- 108 Sandtrap Ridge
- 112 Sandtrap Ridge
- 616 White Cedar Ct
- 611 White Cedar Ct
- 614 White Cedar Ct
- 609 White Cedar Ct
- 607 White Cedar Ct
- 102 Greensway
- 107 Sandtrap Ridge
- 104 Greensway
- 201 Greensway
- 105 Sandtrap Ridge
- 104 Sandtrap Ridge
- 101 Greensway
- 0 Sandtrap Ridge
- 106 Greensway
- 203 Greensway
- 102 Sandtrap Ridge
- 202 Greensway
- 107 Greensway