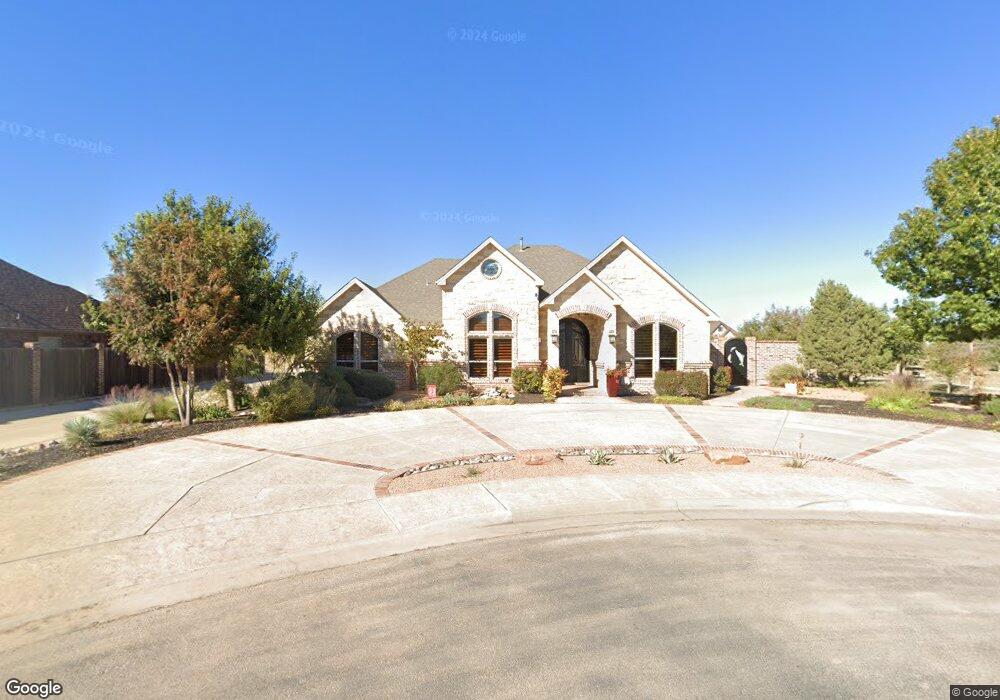
1100 Castle Rock Ct Midland, TX 79705
Estimated Value: $752,679 - $817,000
--
Bed
--
Bath
3,482
Sq Ft
$224/Sq Ft
Est. Value
About This Home
This home is located at 1100 Castle Rock Ct, Midland, TX 79705 and is currently estimated at $780,670, approximately $224 per square foot. 1100 Castle Rock Ct is a home with nearby schools including Santa Rita Elementary School, Midland High School, and Midland Freshman High School.
Ownership History
Date
Name
Owned For
Owner Type
Purchase Details
Closed on
Nov 3, 2011
Sold by
Payne Homes Inc
Bought by
Moore Ken E and Moore Deanna K
Current Estimated Value
Purchase Details
Closed on
Mar 31, 2011
Sold by
Midland Land Development Company
Bought by
Payne Homes Inc
Home Financials for this Owner
Home Financials are based on the most recent Mortgage that was taken out on this home.
Original Mortgage
$422,000
Interest Rate
4.92%
Mortgage Type
Purchase Money Mortgage
Create a Home Valuation Report for This Property
The Home Valuation Report is an in-depth analysis detailing your home's value as well as a comparison with similar homes in the area
Home Values in the Area
Average Home Value in this Area
Purchase History
| Date | Buyer | Sale Price | Title Company |
|---|---|---|---|
| Moore Ken E | -- | West Texas Abstract & Title | |
| Payne Homes Inc | -- | West Texas Abstract & Title |
Source: Public Records
Mortgage History
| Date | Status | Borrower | Loan Amount |
|---|---|---|---|
| Previous Owner | Payne Homes Inc | $422,000 |
Source: Public Records
Tax History Compared to Growth
Tax History
| Year | Tax Paid | Tax Assessment Tax Assessment Total Assessment is a certain percentage of the fair market value that is determined by local assessors to be the total taxable value of land and additions on the property. | Land | Improvement |
|---|---|---|---|---|
| 2025 | $6,276 | $789,570 | $62,420 | $727,150 |
| 2024 | $6,292 | $797,650 | $62,420 | $735,230 |
| 2023 | $6,011 | $752,400 | $62,420 | $689,980 |
| 2022 | $11,699 | $748,760 | $62,420 | $686,340 |
| 2021 | $12,631 | $748,760 | $62,420 | $686,340 |
| 2020 | $8,816 | $659,100 | $62,420 | $596,680 |
| 2019 | $12,478 | $659,100 | $62,420 | $596,680 |
| 2018 | $12,175 | $626,180 | $62,420 | $563,760 |
| 2017 | $11,966 | $615,420 | $62,420 | $553,000 |
| 2016 | $11,141 | $579,980 | $62,420 | $517,560 |
| 2015 | -- | $579,980 | $62,420 | $517,560 |
| 2014 | -- | $548,590 | $0 | $0 |
Source: Public Records
Map
Nearby Homes
- 1 Hialeah Dr
- 5416 Alysheba Ln
- 1215 Burgundy
- 5408 E Loop 250e Unit A
- 2501 Regency Oaks
- 2507 Regency Oaks
- 5011 Los Alamitos Dr
- 5004 Los Alamitos Dr
- 5007 Los Alamitos Dr
- 5013 Polo Pkwy
- 5000 Thames Ct
- 212 Bayberry Pkwy
- 2016 Coleman Ct
- 209 Bayberry Pkwy
- 2706 Savoy Place
- 4901 Lancashire Rd
- 4902 Los Alamitos Dr
- 2911 Yellowstone Ct
- 2801 Savoy Place
- 2807 Chelsea Place
- 1102 Castle Rock Ct
- 1101 Silverton Dr
- 1103 Silverton Dr
- 1104 Castle Rock Ct
- 1103 Castle Rock Ct
- 1105 Silverton Dr
- 1105 Castle Rock Ct
- 1106 Castle Rock Ct
- 1107 Silverton Dr
- 1107 Castle Rock Ct
- 1100 Silverton Dr
- 1006 Silverton Dr
- 1102 Silverton Dr
- 1004 Silverton Dr
- 1110 Telluride Ct
- 1108 Telluride Ct
- 1002 Silverton Dr
- 1104 Silverton Dr
- 1112 Telluride Ct
- 1200 Castle Rock Ct