1100 Grant St Longmont, CO 80501
Loomiller NeighborhoodEstimated Value: $406,000 - $472,000
3
Beds
1
Bath
1,304
Sq Ft
$340/Sq Ft
Est. Value
About This Home
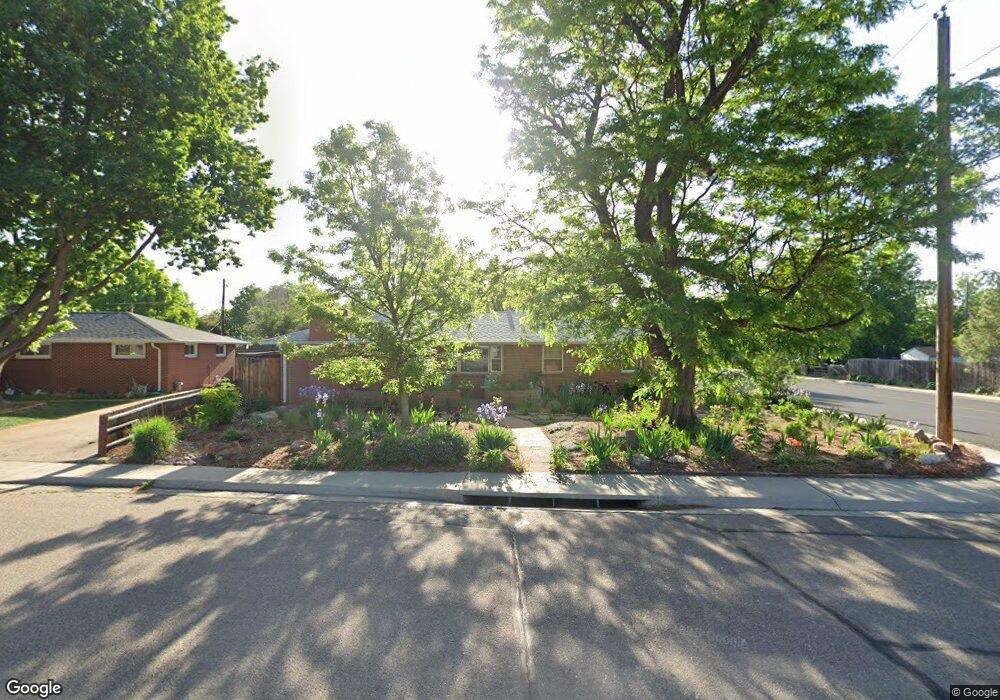
This home is located at 1100 Grant St, Longmont, CO 80501 and is currently estimated at $443,242, approximately $339 per square foot. 1100 Grant St is a home located in Boulder County with nearby schools including Mountain View Elementary School, Longs Peak Middle School, and Longmont High School.
Ownership History
Date
Name
Owned For
Owner Type
Purchase Details
Closed on
Oct 31, 2000
Sold by
Leonard Nance L
Bought by
Leonard James
Current Estimated Value
Home Financials for this Owner
Home Financials are based on the most recent Mortgage that was taken out on this home.
Original Mortgage
$144,800
Outstanding Balance
$43,532
Interest Rate
7.43%
Estimated Equity
$399,710
Purchase Details
Closed on
Jun 28, 1996
Sold by
Mason Rodney J
Bought by
Leonard Nance L
Home Financials for this Owner
Home Financials are based on the most recent Mortgage that was taken out on this home.
Original Mortgage
$118,916
Interest Rate
8.05%
Mortgage Type
FHA
Purchase Details
Closed on
Jun 15, 1993
Bought by
Leonard Nance L and Leonard James
Purchase Details
Closed on
Jan 24, 1989
Bought by
Leonard Nance L and Leonard James
Create a Home Valuation Report for This Property
The Home Valuation Report is an in-depth analysis detailing your home's value as well as a comparison with similar homes in the area
Home Values in the Area
Average Home Value in this Area
Purchase History
| Date | Buyer | Sale Price | Title Company |
|---|---|---|---|
| Leonard James | -- | Title America | |
| Leonard Nance L | $119,900 | -- | |
| Leonard Nance L | $87,500 | -- | |
| Leonard Nance L | -- | -- |
Source: Public Records
Mortgage History
| Date | Status | Borrower | Loan Amount |
|---|---|---|---|
| Open | Leonard James | $144,800 | |
| Closed | Leonard Nance L | $118,916 |
Source: Public Records
Tax History Compared to Growth
Tax History
| Year | Tax Paid | Tax Assessment Tax Assessment Total Assessment is a certain percentage of the fair market value that is determined by local assessors to be the total taxable value of land and additions on the property. | Land | Improvement |
|---|---|---|---|---|
| 2025 | $1,659 | $24,969 | $5,669 | $19,300 |
| 2024 | $1,659 | $24,969 | $5,669 | $19,300 |
| 2023 | $1,637 | $24,046 | $6,345 | $21,386 |
| 2022 | $1,352 | $20,613 | $4,663 | $15,950 |
| 2021 | $1,370 | $21,207 | $4,798 | $16,409 |
| 2020 | $1,126 | $18,741 | $4,219 | $14,522 |
| 2019 | $1,108 | $18,741 | $4,219 | $14,522 |
| 2018 | $1,446 | $15,221 | $3,744 | $11,477 |
| 2017 | $1,426 | $16,827 | $4,139 | $12,688 |
| 2016 | $1,378 | $14,416 | $5,015 | $9,401 |
| 2015 | $1,313 | $12,592 | $3,900 | $8,692 |
| 2014 | $1,176 | $12,592 | $3,900 | $8,692 |
Source: Public Records
Map
Nearby Homes
- 1217 Lincoln St
- 1136 Venice St
- 1247 Lincoln St
- 1209 Gay St
- 1224 Judson St
- 1202 Vivian St
- 1153 Vivian St
- 1214 9th Ave
- 1314 Venice St
- 1344 Aspen Place
- 1321 Judson St
- 1208 Juniper St
- 818 Lincoln St
- 1245 Sumner St
- 1012 Pratt St Unit 1012
- 1019 Alta St Unit 1019
- 814 Gay St
- 813 Vivian St
- 1061 Townley Cir
- 1365 15th Ave