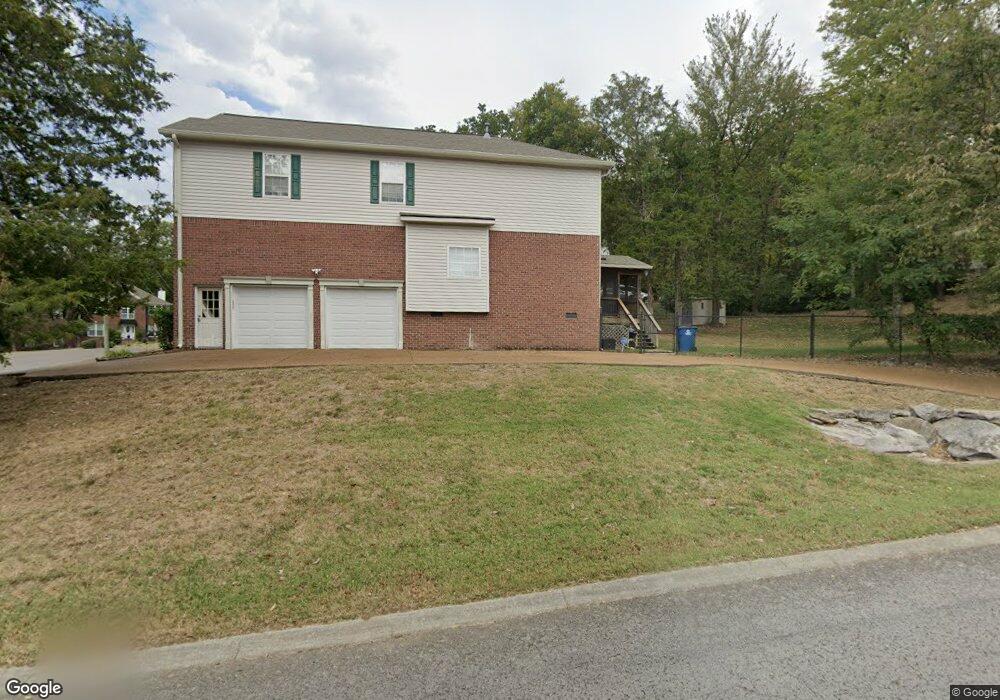
1100 Michelle Ct Nolensville, TN 37135
Estimated Value: $687,000 - $846,000
--
Bed
3
Baths
2,806
Sq Ft
$282/Sq Ft
Est. Value
About This Home
This home is located at 1100 Michelle Ct, Nolensville, TN 37135 and is currently estimated at $790,415, approximately $281 per square foot. 1100 Michelle Ct is a home located in Williamson County with nearby schools including Nolensville Elementary School, Mill Creek Middle School, and Nolensville High School.
Ownership History
Date
Name
Owned For
Owner Type
Purchase Details
Closed on
Oct 19, 2009
Sold by
Lurker Christine Michelle
Bought by
Lurker Charles E
Current Estimated Value
Purchase Details
Closed on
Jan 2, 2003
Sold by
Nobrega Lurker Laura
Bought by
Lurker Charles E
Purchase Details
Closed on
Nov 16, 2000
Sold by
Lurker Charles E and Lurker Laura N
Bought by
Lurker Charles E and Nobrega Lurker Laura
Home Financials for this Owner
Home Financials are based on the most recent Mortgage that was taken out on this home.
Original Mortgage
$70,806
Outstanding Balance
$25,637
Interest Rate
7.82%
Estimated Equity
$764,778
Purchase Details
Closed on
Dec 15, 1999
Sold by
Castle Builders Llc
Bought by
Lurker Charles E and Lurker Laura N
Home Financials for this Owner
Home Financials are based on the most recent Mortgage that was taken out on this home.
Original Mortgage
$171,900
Outstanding Balance
$52,881
Interest Rate
7.85%
Estimated Equity
$737,534
Purchase Details
Closed on
Mar 26, 1999
Sold by
Castle Development & Real Estate Llc
Bought by
Castle Builders Llc
Home Financials for this Owner
Home Financials are based on the most recent Mortgage that was taken out on this home.
Original Mortgage
$171,000
Interest Rate
6.82%
Mortgage Type
Construction
Create a Home Valuation Report for This Property
The Home Valuation Report is an in-depth analysis detailing your home's value as well as a comparison with similar homes in the area
Home Values in the Area
Average Home Value in this Area
Purchase History
| Date | Buyer | Sale Price | Title Company |
|---|---|---|---|
| Lurker Charles E | -- | None Available | |
| Lurker Charles E | -- | -- | |
| Lurker Charles E | -- | -- | |
| Lurker Charles E | $214,900 | -- | |
| Castle Builders Llc | $52,000 | Cumberland Title Company |
Source: Public Records
Mortgage History
| Date | Status | Borrower | Loan Amount |
|---|---|---|---|
| Open | Lurker Charles E | $70,806 | |
| Open | Lurker Charles E | $171,900 | |
| Previous Owner | Castle Builders Llc | $171,000 |
Source: Public Records
Tax History Compared to Growth
Tax History
| Year | Tax Paid | Tax Assessment Tax Assessment Total Assessment is a certain percentage of the fair market value that is determined by local assessors to be the total taxable value of land and additions on the property. | Land | Improvement |
|---|---|---|---|---|
| 2025 | $2,487 | $177,400 | $47,500 | $129,900 |
| 2024 | $2,487 | $114,650 | $21,250 | $93,400 |
| 2023 | $2,487 | $114,650 | $21,250 | $93,400 |
| 2022 | $2,487 | $114,650 | $21,250 | $93,400 |
| 2021 | $2,487 | $114,650 | $21,250 | $93,400 |
| 2020 | $2,176 | $86,700 | $15,000 | $71,700 |
| 2019 | $2,055 | $86,700 | $15,000 | $71,700 |
| 2018 | $1,994 | $86,700 | $15,000 | $71,700 |
| 2017 | $1,977 | $86,700 | $15,000 | $71,700 |
| 2016 | $0 | $86,700 | $15,000 | $71,700 |
| 2015 | -- | $71,300 | $12,500 | $58,800 |
| 2014 | -- | $71,300 | $12,500 | $58,800 |
Source: Public Records
Map
Nearby Homes
- 0 Nolensville Rd Unit RTC2807764
- 0 Nolensville Rd Unit RTC2818506
- 0 Bostic Unit RTC2516475
- 0 Nolensville Rd Unit RTC3017763
- 1115 Oak Creek Dr
- 829 Stonebrook Blvd
- 720 Stonecastle Place
- 1016 Dortch Ln
- 813 Stonebrook Blvd
- 607 Quarter Horse Ln
- 2248 Rolling Hills Dr
- 2276 Rolling Hills Dr
- 1228 Countryside Rd
- 3025 Ash Dale Ln
- 3051 Ash Dale Ln
- 3019 Ash Dale Ln
- 3027 Ash Dale Ln
- 625 Mer Rouge Dr
- 4028 Rosa Dr
- 825 Piccadilly Dr
- 1102 Michelle Ct
- 815 Rockwood Dr
- 812 Rockwood Dr
- 1101 Michelle Ct
- 1104 Michelle Ct
- 813 Rockwood Dr
- 811 Rockwood Dr
- 1105 Michelle Ct
- 817 Rockwood Dr
- 809 Rockwood Dr
- 1103 Michelle Ct
- 810 Rockwood Dr
- 800 Brownstone Ct
- 807 Rockwood Dr
- 1004 Austin Ct
- 1006 Austin Ct
- 1131 Oak Creek Dr
- 1129 Oak Creek Dr
- 808 Rockwood Dr
- 1133 Oak Creek Dr